By Group "PoliVoli"
Introduction
Predicting stock prices has always been difficult because so many factors can influence market movements. Global events, policy changes and even statements by public figures can cause markets to move dramatically and without warning. For example, when the US raises interest rates, the stock market tends to fall because tighter money causes investors to move their money to the banks, which reduces their investment in stocks. Or if an investor misjudges the timing of an interest rate hike, he could face huge losses. Sudden political statements can also move markets significantly. This study will focus on Trump's social media activity to explore whether there is a correlation between the sentiment of his posts and increased stock market volatility.
Our choice to focus on market volatility has particular considerations. Trump's statements may positively or negatively impact specific firms or industries, but it is extremely difficult for the public to predict the direction of his next statement about a particular firm. For outsiders, his future rhetoric is inherently random. And volatility precisely reflects market uncertainty. If it turns out that Trump's posts with high subjectivity scores tend to coincide with higher volatility (regardless of whether the market rises or falls), this finding in itself could be enough to help investors take precautionary measures ahead of time, such as hedging with options or adjusting their portfolios in response to market shocks. Our goal is to reveal patterns of correlation between Trump's social media sentiment and the Chicago Board Options Exchange Volatility Index (Cboe VIX).
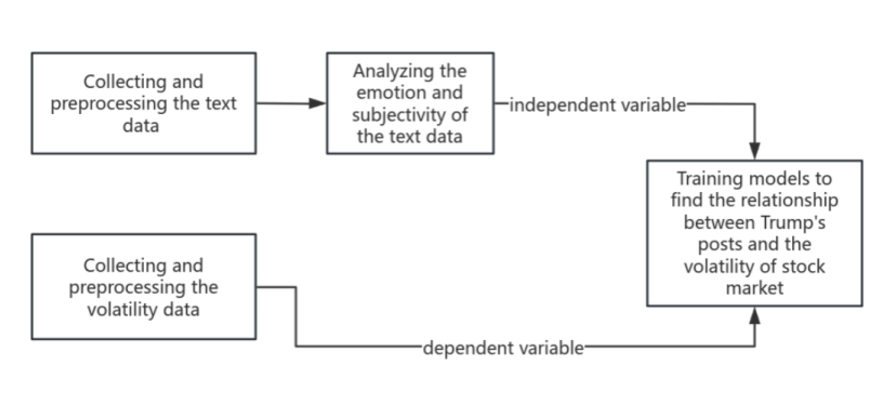
To address this problem, we plan to adopt a three-stage program (shown in Figure 1). First, we will collect and preprocess data: social media posts (text data) of Trump and their corresponding daily VIX index values from 2017-2025. Second, natural language processing (NLP) techniques are applied to quantify the sentiment tendency (positive/negative) and subjectivity (personal opinion vs. factual statements) of each post. Finally, we input these sentiment indicators into the model to verify whether we can predict high volatility versus low volatility trading days. At this stage, we tentatively decided to try a Random Forest model for categorical analysis because our target variable (whether volatility spikes or not) is essentially a binary event, and we believe that robust integration methods such as Random Forests can capture non-linear relationships and interactions in the data.
Data Collection – Trump’s Posts and Market Volatility Data
Why Trump's tweets and posts from 2017 to 2025? Because we needed a complete dataset covering Trump's long-term personal rhetoric, both during his time in office (2017 to January 2021, his active tweeting phase) and after he left office (switching to the Truth Social platform). This time span both shows the trajectory of the evolution of his market influence and ensures that we have a sufficient observational sample of posts and market reactions. But getting the data wasn't easy. Initially we considered crawling tweets directly, but API access to Twitter has been cut off, and the Truth Social platform itself presents challenges as there is no official API. To access the data, we turned to publicly available archives already compiled by other researchers.
Twitter archive: we found that user MarkHershey has created a complete archive of Trump tweets on GitHub (covering all tweets from 2017-2021 in office). This publicly available resource saved a significant amount of time compared to direct API access, which is no longer available. The archive contains the timestamp and full content of each tweet, exactly the core data needed for text analytics. We pay particular attention to tweets from the presidency, a period when markets appeared responsive to his public statements on topics such as trade tariffs or specific companies. It is these events that motivate our research.
Truth Social Platforms Archive: for Trump's post-2022 tweets, we found a GitHub project created by Matt Stiles that automatically updates an archive of Trump's postings on truth social platforms. The repository is complete with raw data from the Truth Social Platform from its launch (late 2021/early 2022) to October 25, 2025. The choice to focus on the truth social platforms is due to the fact that since Trump’s Twitter account was suspended in January 2021, Truth Social has been his primary platform for public statements. In order to continue the analysis beyond 2021, these posts are critical. Employing archived data is indeed expedient, as the original crawl script is no longer maintained, but the repository owner has kept the required data intact. As a result, by integrating the Twitter and Truth in Social datasets, we ended up with a complete record of Trump's public postings from early 2017 through late 2025 - a solid foundation for subsequent analysis.
Market Volatility (VIX) Data: to measure stock market volatility, we chose the Chicago Board Options Exchange Volatility Index (VIX). The VIX was chosen because it is the most widely used indicator of market volatility and is often referred to as the “panic index”. The index is published by the Chicago Board Options Exchange and is based on the price of S&P 500 options to project market participants' expectations of volatility over the next 30 days. In short, a spike in the VIX means that traders expect the market to move violently (up or down). We obtained daily VIX historical data for 2017-2025 from an official source (Investing.com Historical Data Board). From this, we obtained the daily VIX closing values and the opening, high and low prices for each trading day. In this context, matching the VIX data time period with the Trump tweet data time period is crucial, as it ensures that on a given date, each Trump tweet, or no tweet, corresponds to a quantitative indicator of market volatility.
The key question now is how to define modelable “volatility events” or high volatility. Since the VIX is a continuous value on a daily basis, we decided to use a binary categorization: “high volatility days” versus “low/normal volatility days”. In order to set the thresholds objectively, we analyzed the distribution of VIX values during the study period. We chose the VIX mean and median as potential cut-off points. Why? The median naturally divides the high and low halves of volatility observations, while the mean (which can be affected by sharp fluctuations) provides an alternative reference benchmark.
By categorizing trading days as “high volatility” (above threshold) and “low volatility” (below threshold), we reduce the forecasting problem to a binary outcome. This approach fits our application scenario because investors mainly need to determine whether volatility is abnormally high or not, rather than precisely predicting the exact magnitude of the change in the VIX index. Moreover, the use of binary variables is suitable for categorical models, which are more resistant to outliers than regression models, because extreme spikes in the VIX do not distort the model, but are only treated as “high volatility” events like other high volatility days. To avoid overly influencing the results by threshold selection preferences, we will test both the mean and the median as threshold rules (the median may be slightly more conservative if the distribution is skewed).
At the same time, “abnormally high” volatility can be defined not only by the VIX level, but also by short-term changes in volatility around the time of Trump's tweets. Therefore, we examine Δ-1, Δ+1, and Δ+2 change indicators. In addition to the dates by volatility level, we also calculate multiple indicators of volatility change around the date of Trump's tweet:
Δ-1: the change in the VIX from the previous trading day to the tweet release date
Δ+1: the magnitude of the change from the day the tweet was released to the next trading day
Δ+2: the magnitude of the change from the day of the tweet to two trading days later.
The inclusion of these metrics is intended to capture the immediate impact of Trump's comments before and after, as his tweets are posted at irregular times: sometimes before the market opens, sometimes in the middle of the afternoon, sometimes late at night. A single day's VIX close may not reflect the full picture - the market may have shown nervousness the day before (reflected in Δ-1) or the market's reaction may have been delayed a day in showing up (reflected in Δ+1 or even Δ+2). By measuring the change in volatility before and after the tweets, we aim to more accurately distinguish the impact of Trump's comments from other unrelated market events. For example, if the VIX had been climbing continuously prior to Trump's remarks, the increase could have stemmed from other news; the inclusion of Δ-1 as a characteristic quantity avoids misattributing it to Trump. Similarly, Δ+1 and Δ+2 enable us to observe whether volatility continued to spike or leveled off in the days following the remarks, which could be a sign that the market digested his remarks. We also extract the daily intraday high/low range and the absolute difference between the open and close prices. These two indicators reflect the intensity of intraday volatility - sometimes the VIX closes weakly, but violent intraday jolts still indicate market turbulence. Incorporating an intraday volatility indicator is critical, as Trump's midday tweets can trigger a brief intraday jump followed by a pullback; even if the net movement is small, the high-low spreads can still capture this type of volatility. By using a combination of these volatility indicators, we can define or identify “volatility events” in multiple dimensions.
At the practical level, we use simple heuristics to initially label the classification targets and then evaluate the robustness of the different definitions. Under the delta-based labeling rule, if the VIX rises (i.e., Δ0 or Δ+1 is positive) within a short period of time before and after a tweet, it is labeled as 1 (high volatility). This is the initial definition used for current model training, with the intuitive logic that there may be correlation if volatility rises in a short period of time after the release of their remarks. Meanwhile, under the threshold labeling rule, which marks a high volatility day when the VIX is above the threshold and a low volatility day otherwise, we will test both mean and median thresholding schemes. We recognize that these are still rough measures: not all volatility rises stem from Trump, and sometimes his rhetoric may dampen declines rather than trigger rises. Future iterations may require VIX volatility to exceed specific thresholds or be compared to average market performance to improve scientific rigor. However, at this stage these simple rules provide a practical starting point for categorization and allow us to compare the results of both the median/mean threshold approach and the delta-based event definition.
Data Preprocessing – Cleaning and Aligning the Data
With data in hand, the next step was cleaning it up and aligning Trump’s posts with the correct trading days.
Cleaning the Text Data
Our original data files contain a large number of strange characters (called "mojibake"). This is due to text encoding errors (e.g., UTF-8 text being incorrectly interpreted as Latin-1). We need Trump's posts to appear in the correct word form, as any garbled characters will interfere with our subsequent sentiment analysis. So, fixing text encoding was priority one. We wrote a custom fix_mojibake function to systematically detect these weird character patterns and convert them to the proper text. Meanwhile, Trump’s posts contain a lot of special characters (emojis, fancy quotes, dashes, etc.), and a robust fix helps ensure we don’t lose or distort information like emphasis or sarcasm indicated by punctuation. Our function first tries to re-interpret the text in the correct encoding (by encoding as Latin-1 and decoding as UTF-8) and then falls back on a dictionary of known bad-to-good character mappings. This two-step approach was chosen because some errors could be fixed by re-encoding, while others needed explicit replacement. It took some time to refine (we encountered many edge cases), but the result was a near-complete recovery of the original post content.
After correctly decoding the text, we performed standard text cleanup. Sometimes, Trump's social media posts included retweets or "retweet the truth" (starting with "RT"), user mentions, and URLs pointing to articles or videos. We systematically removed this content. The rationale is that we only focus on Trump's personal statements and emotions—sharing Fox News links or retweeting others' tweets doesn't reflect his personal emotional tone, and URLs and mentions don't contain meaningful emotional information. We used a URL extraction library to remove links and all content starting with "RT." We performed this on both Truth Social and Twitter data. This cleanup effectively reduces noise: extra words or symbols irrelevant to emotion can interfere with our sentiment model (e.g., "http" or "t.co" might be considered neutral). By cleansing this content, we ensured that our sentiment algorithm focused on the actual information content. We also removed posts that were completely blank after removing these elements.
One tricky issue we encountered was CSV formatting. The Truth Social CSV had 8 columns per row (like timestamp, content, likes, etc.), but many posts contained commas or line breaks that were not handled properly, causing some posts to spill into extra columns. This misalignment meant that a post’s content might get split, and the numeric fields (like replies_count, likes_count) would shift columns, making the data inconsistent. We noticed that some rows were missing values where they should have been numbers, or contained impossible values (e.g., a date field appearing in a likes column). Therefore, we wrote a fix: for each row, we checked if a field that should have contained a number actually did. If not, we assumed it was due to a data misalignment caused by commas in the content. We then re-merged the data until it aligned with the numeric field. This reconstructed the complete content of each post and correctly adjusted the counts. After fixing the Truth Social data structure, doing the same for Twitter was much easier: Twitter content sometimes contained commas/newlines in columns where numbers shouldn't have been, but since there were no important columns after the content (perhaps only the ID), we could simply merge all the trailing columns into a single content field.
After data cleaning, we obtained two cleaned datasets of Trump posts, each containing timestamps and clean text content suitable for sentiment analysis. We then decided to merge the two data sources (Twitter and Truth Social) to unify the timeline of postings. This simplifies future alignment with VIX data—we only need to handle consecutive date series. Furthermore, this approach ensures data consistency should we need to build features such as "Was a post published today?". During the merging process, we were very careful, retaining all fields and logging platform information where necessary, although the platform may not be important for the analysis since all content represents Trump's voice.
Aligning Posts with Trading Days
Since VIX data is indexed by trading days (no data on weekends or holidays), each value actually represents the volatility index as of the market close on that day (VIX closes at 3:15 PM Central Time). However, Trump's posting times are uncertain, requiring us to map each post to the correct trading day. For example, a post late on Sunday, May 3rd should be associated with the VIX index on Monday, May 4th (since markets are closed on Sundays and would only react on Monday).
We verified the timestamps of posts across both social media platforms by cross-checking and consulting a friend in the U.S., as these platforms default to UTC time. Subsequently, we converted all timestamps to Central Time (CT), the time zone used for VIX data. Additionally, due to market closing times, any posts published after 3:15 PM CT should be attributed to the next trading day's volatility, as the market had no opportunity to react that day. Conversely, posts published before 3:14 PM CT fall within the influence of that day's trading session. To address this, we shift timestamps forward by 8 hours and 45 minutes. This ensures all posts published after 3:15 PM CT are timestamped after midnight on the following day. After this time adjustment, we can directly use the date portion of the timestamp as the “effective trading day.”
We must also account for market closures. If the next date falls on a Saturday or a holiday like July 4th, simply shifting to the next calendar date is insufficient. To address this, we extracted the NYSE trading calendar (using the pandas_market_calendars library) to obtain a list of all valid trading days. Then, for each post's tentative trading date, if it falls on a non-trading day, we shift it to the next actual trading day.
This alignment is vital for the integrity of our analysis. It means when we later aggregate Trump’s posts or sentiment by day, and compare to that day’s VIX movement, we’re doing it in the right way. Without it, we might mistakenly link a Sunday night post to the previous Friday’s market (which had no knowledge of it), or we’d miss the effect on Monday.
Sentiment Analysis – Measuring Emotion and Subjectivity
With clean, time-aligned text data, we can move on to the natural language processing stage: extracting sentiment signals from Trump's statements. We hypothesize that when Trump's tone is highly emotional or subjective, it may create uncertainty or excitement in the market, leading to increased market volatility. To test this hypothesis, we need to quantify two aspects of each article: polarity (positive/negative degree) and subjectivity. We chose two methods, TextBlob and VADER, to calculate these metrics. Here are the reasons for our choice of these two methods and their respective advantages:
TextBlob
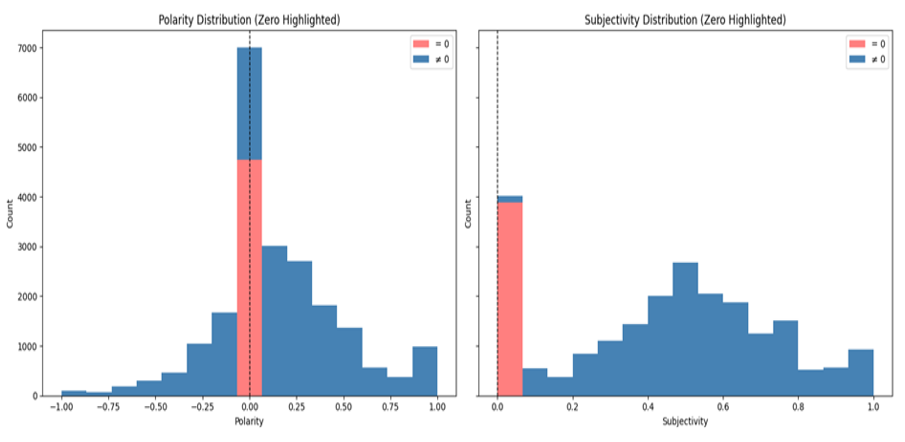
We chose TextBlob because it is a well-known and easy-to-use library that provides ready-made sentiment analysis capabilities. It works by breaking down text into words and phrases and using a lexicon (from a library included in NLTK for part-of-speech tagging) combined with some basic grammatical rules. For each post, TextBlob returns two key values: polarity, ranging from -1 to 1, where -1 represents very negative, 0 represents neutral, and +1 represents very positive; and subjectivity, ranging from 0 to 1, where 0 represents a purely objective statement and 1 represents highly subjective/opinion-based. Highly subjective posts indicate that Trump has mixed personal opinions or emotions into the post, which could create more uncertainty among investors and potentially lead to greater market volatility. TextBlob's strengths lie in its high transparency and fast computation speed. However, we also recognized that its use of a general English lexicon, word-by-word scoring, and an overly linear sentiment weighting algorithm could lead to misunderstandings of complex contexts. As our results show, in the Polarity score, Trump's sentiment approximates a normal distribution, but in the Subjectivity score, Trump's posts tend to be more subjective. This suggests that the simple summation method of TextBlob may not be accurate when dealing with long texts. We may need a more complex model to transform long tweets like Trump's, which are characterized by strong sentiment and strong subjectivity. Therefore, we subsequently tried to supplement it with VADER.
VADER (Valence Aware Dictionary for Sentiment Reasoning)
We attempted to supplement TextBlob after believing its limitations might affect the final data transformation. Designed specifically for short, informal texts like tweets, VADER addresses the logical inversions between multiple words compared to TextBlob's single-word scoring. For example, if "not" precedes "good," VADER reverses the overall sentiment. Therefore, we believed it should perform better on informal, sentiment-rich texts such as social media posts.
VADER breaks down sentiment into positive, negative, and neutral components and constructs a weighted summation of a comprehensive sentiment score from -1 to 1 (similar to TextBlob's Polarity). We hoped that by using VADER, we could more accurately capture this sentiment and reflect readers' (and investors') potential reactions to Trump's tone.
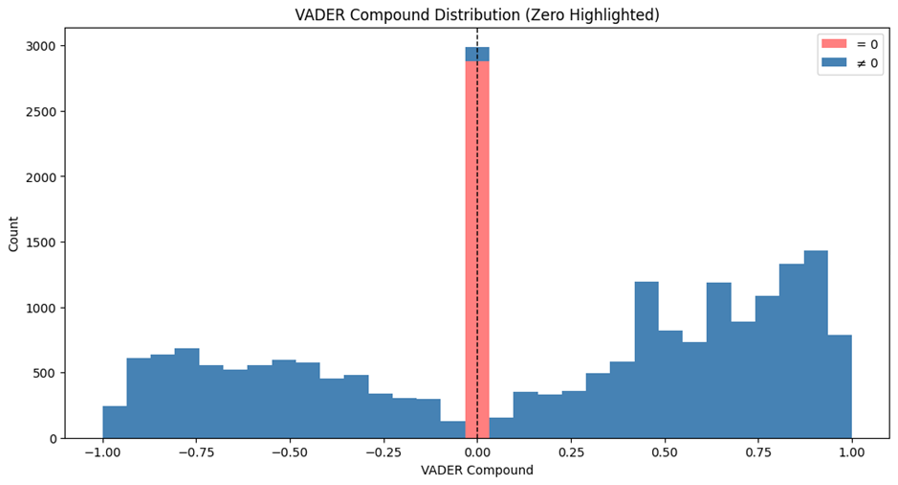
In terms of results, VADER provided what we considered a more comprehensive score. Because platforms like Twitter and Truth tend to elicit more emotional responses, we believe Trump's posts will exhibit stronger sentiment polarity. This is difficult to discern in the scores provided by TextBlob. However, in the Compound scores provided by VADER, we can clearly observe a more even distribution of sentiment across the axis in Trump's tweets, a result we consider more reliable.
Modeling Volatility from Sentiment – Our Strategy
Finally, let's discuss how to link the sentiment of Trump's posts with market volatility data. As mentioned earlier, we model it as a classification problem: given the sentiment characteristics of Trump's posts on a given day, can we predict whether market volatility will surge that day? We choose classification (high volatility vs. low volatility) rather than predicting a precise VIX value for two reasons. First, investors want a quick warning of market turmoil; a specific point is difficult to predict and can be misleading. Second, Trump's impact on the market may be non-linear, meaning volatility may only spike when the uncertainty brought by a Trump post exceeds extreme levels. Regression might weaken this effect, while classification is better suited for this task.
Our next step will be trying the random forest classifier. As a relatively well-understood machine learning model, random forests can capture the non-linear relationships and interactions between sentiment features (e.g., the combination of high negative sentiment and high subjectivity). Furthermore, due to the complexity of the transformation between sentiment and volatility, it is difficult to fit the data using linear models, which would reduce the interpretability of our results. However, in this task, we want to avoid using black-box models as much as possible. Random forests provide a feature importance metric, allowing us to explain which sentiment signals (e.g., subjectivity and negative sentiment) are most important for predicting market volatility, thereby improving the interpretability of the results.
Next Steps
In the next step, the real test will be to train the model and verify that our intuition holds true: do days with high-sentiment posts from Trump coincide with, or even predict, days of elevated market volatility? A follow-up report will present model performance, interesting patterns (e.g., whether highly subjective content on the Truth Social platform correlates with sharp market shocks during 2022-2023), and other possible unexpected findings. If the results do not meet expectations, we will explore options for improvement: e.g., adding contextual information (are the posts about economic policy or trivia?), or using more advanced techniques such as BERT. or using more advanced natural language processing techniques such as BERT to capture context.
By articulating our thinking at each step, we hope to clearly demonstrate that all choices are based on domain knowledge or practical constraints, and that each decision brings value to solving the puzzle of the relationship between Trump and market volatility. Stay tuned for the final results, which will reveal how a single individual's tweets can move markets, and what exactly is their impact?
References
[1] stiles, "trump-truth-social-archive," GitHub, Github-trump-truth (accessed Jan. 9, 2026).
[2] MarkHershey, "CompleteTrumpTweetsArchive," GitHub, TrumpTweetsArchive (accessed Jan. 9, 2026).
[3] "TextBlob Documentation," Read the Docs, TextBlob (accessed Jan. 9, 2026).
[4] "Natural Language Toolkit (NLTK)," NLTK Project, NLTK Project (accessed Jan. 9, 2026).
[5] "VADER Sentiment Documentation," Read the Docs, VADER (accessed Jan. 9, 2026).