By Group "NullPointer"
Title: The Role of NLP Sentiment in U.S. Election Stock Performance
Date: 2025-03-10 10:00
Author: NullPointer
Category: Finance
Tags: 2024 election, stock market, NLP, sentiment analysis
1. Link between NLP and U.S. Election-related Stock Performance
Introduction
With elections being a pivotal event that influences various sectors of the economy, we sought to investigate how public sentiment, as expressed through social media, correlates with fluctuations in the stock market. Specifically, we focused on leveraging Natural Language Processing (NLP) techniques to uncover patterns and insights that might shed light on this complex relationship.
Methodology
To begin, we collected a large dataset of tweets related to the U.S. election, sourced from the social media platform X. Our next step involved generating word clouds to visually explore the potential link between the content of these tweets and stock market performance. To ensure the clarity and relevance of our findings, we preprocessed the data by excluding stop words—common words like the, and, or, isthat carry little semantic weight—as well as overtly political terms such as election, vote, or party names. This allowed us to narrow our focus exclusively to financial and economic terminology, which we hypothesized would more directly reflect market-related sentiment.
Results and Discussion
From our results, several key observations emerged.
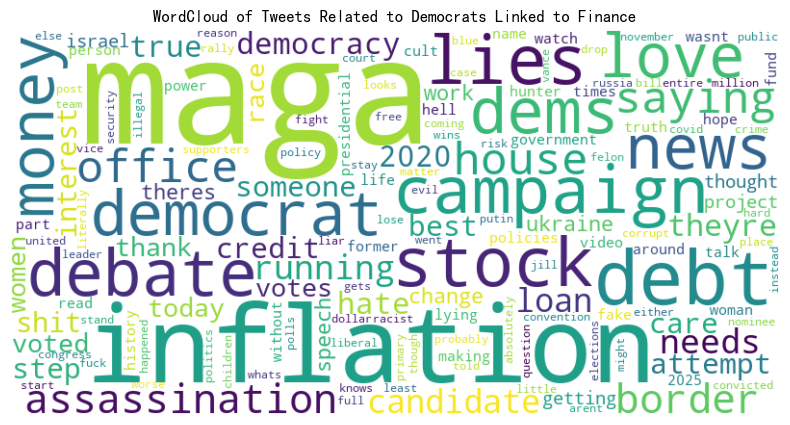
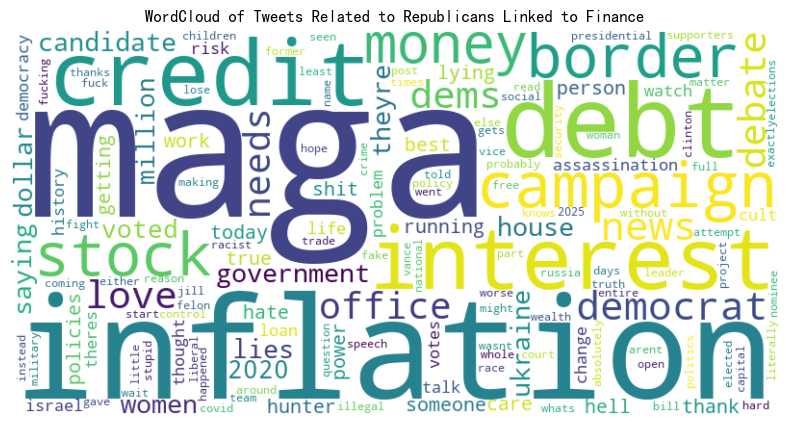
The word stock appeared with notable frequency in tweets associated with both the Democratic and Republican parties, suggesting that discussions about stock market performance transcend partisan lines during election periods. Other financial terms, such as market, investment, and economy, also surfaced prominently, reinforcing the idea that election-related discourse on social media often intersects with economic concerns. This consistent presence of financial vocabulary across party affiliations points to a meaningful connection between tweet content and stock market activity. Our findings indicate that NLP can serve as a powerful tool for extracting actionable insights from unstructured social media data, potentially aiding investors, analysts, and policymakers in understanding how public sentiment during elections might influence financial markets.
2. Sentiment Factor Construction
Methodology
-
Tweet Classification:
+1 if it supports Republicans/Trump
-1 if it supports Democrats/Biden/Harris
0 if neutral -
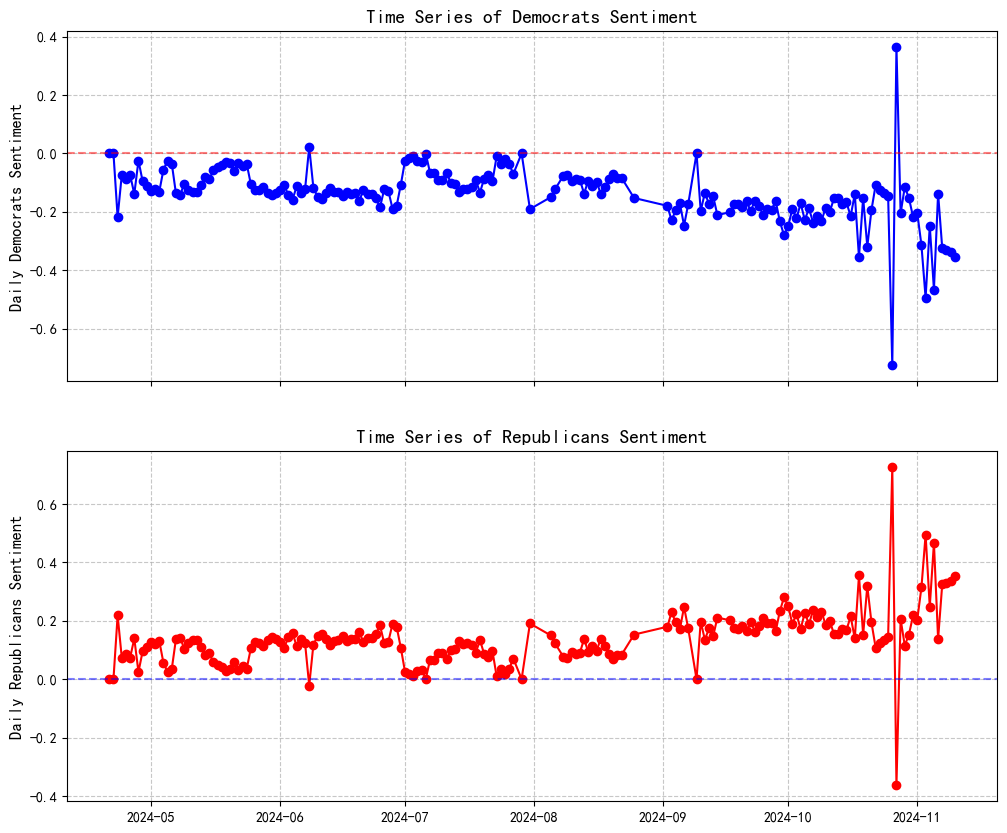
Daily Sentiment Score Calculation:
Average sentiment score across all tweets each day
Formula:

- Time Decay Factor: Higher weight assigned to tweets closer to election day
Formula:
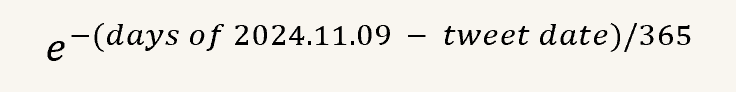
- Time Decay Factor: Higher weight assigned to tweets closer to election day
- Sentiment Score gotten above
3. Investment Strategy Preparation
Portfolio Construction
- Selected top 10 corporate donors of each party as benchmark portfolios
- At 3:00 PM US/Eastern Time, calculated sentiment score using the past 24-hour data
- Computed Relative Sentiment Factor:
-- Republican Sentiment Factor = Republican Sentiment Score - Democratic Sentiment Score
Standardization Process
- 20-day rolling standardization
rs['Sentiment_Factor']=(
    rs['Sentiment_Factor']-rs['Sentiment_Factor'].rolling(20,min_periods=20).mean()
)/rs['Sentiment_Factor'].rolling(20,min_periods=20).std()
- Analyzed correlation between factor change rate and future portfolio returns
- Found a stable negative correlation between them
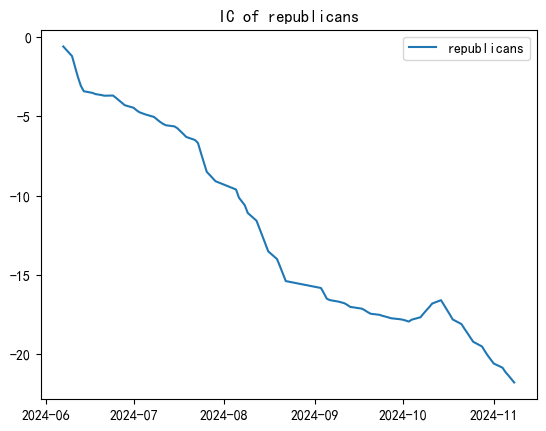
- Note: IC(Information Coefficient) means cummulative correlations between future returns and features in a rolling window(we set window size = 20). Using the code below:
rs['Sentiment Factor change rate'].shift(1).rolling(20).corr(rs['return']).cumsum()
4. Timing Strategy Implementation
Market Trading Strategy Based on Sentiment Factor
Benchmark strategy: Long the portfolio.
We will choose the right time to short the portfolio according to the factor value beyond the Benchmark strategy.
For Republican portfolio
- When sentiment factor > 80th percentile of past 20 days: Short the Republican portfolio
Then we can get the performance below:
.png)
- When sentiment factor > 90th percentile: Adopt a stricter short-selling strategy
_90.png)
For Democratic portfolio
- Applied the same methodology to the Democratic Sentiment Factor
IC and returns are below:
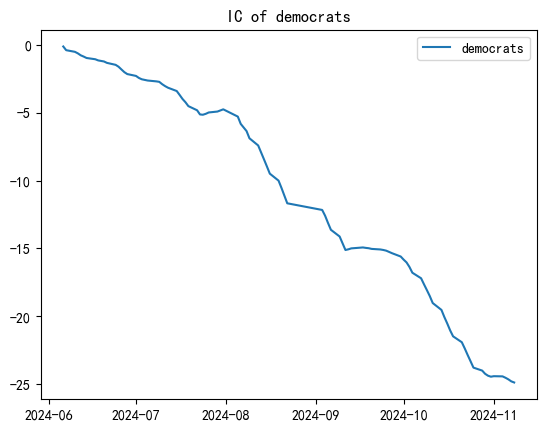
.png)
Conclusion
- Economic Explaination: Both factors show the negative correlation with the stock returns. That implies such a scenario that prices will go irrationally high when people feel optimistic about any party's election, which is a kind of Market Overheating.
- Backtesting results showed that sentiment-based strategies improved returns.
- Demonstrate that market sentiment has predictive power over stock prices
6. Econometric analysis
6.1 Who the CEO support?
The website used to scrape information about which political party these CEOs support is the Federal Election Commission (FEC). It is a public website where after entering the name of the company's CEO, it returns information about the CEO's political campaign contributions. The political party stance of the company is judged based on the CEO's political campaign contributions during the general election period. For example, the following picture shows the results when searching for Elon Musk on the FEC website.
6.2 Fundamental Data and Monthly Return
I use wrds to derive the fundamental data of the company in S&P 500 as the control variables in two-way fixed effect regression. First, I get the company name from wrds and then get the permno of those company.
conn = wrds.Connection()

tickers = party['ticker'].unique()
result_df = conn.raw_sql(f"SELECT permno, ticker FROM crsp.stocknames WHERE ticker IN ({', '.join([f"'{t}'" for t in tickers])})")
Subsequently, I obtained the monthly average returns and fundamental data of the stocks through the following code:
# monthlly return
return_data = conn.raw_sql(f"""
SELECT
    permno,
    date,
    ret
FROM
    crsp.msf
WHERE
    permno IN ({', '.join(map(str, permno_list))})
    AND date BETWEEN '{start_date}' AND '{end_date}'
""")
return_data['date'] = pd.to_datetime(return_data['date'])

monthly_avg_return = return_data.groupby(['permno',return_data['date'].dt.to_period('M')])['ret'].mean()
monthly_avg_return = monthly_avg_return.reset_index()

merged_df = pd.merge(df, monthly_avg_return, on='permno', how='inner')
merged_df = merged_df.drop_duplicates()

# fundamental data
fund_data = conn.raw_sql(f"""
    SELECT gvkey, datadate as date, tic as ticker, at, sale, ni, lt, che, revt, ceq
    FROM comp.funda
    WHERE tic IN {tuple(merged_df['ticker'])}
        AND datafmt = 'STD'
        AND consol = 'C'
        AND indfmt = 'INDL'
        AND datadate >= '2020-01-01'
""")
def convert_to_monthly(group):
    group = group.reset_index().drop_duplicates(subset='date')
    group = group.set_index('date').resample('ME').ffill()
return group.reset_index()

individual_controls = ['at', 'sale', 'ni', 'lt', 'che', 'revt', 'ceq' ]
fund_data['date'] = pd.to_datetime(fund_data['date'])
fund_data = fund_data.set_index('date')
monthly_data = fund_data.groupby('ticker')[individual_controls].apply(convert_to_monthly).reset_index(drop=False)
monthly_data = monthly_data.drop(columns=['level_1'])

start_timestamp = pd.Timestamp(datetime.strptime(start_date, '%Y-%m-%d'))
end_timestamp = pd.Timestamp(datetime.strptime(end_date, '%Y-%m-%d'))

monthly_data  = monthly_data [(monthly_data ['date'] >= start_timestamp) &
                (monthly_data ['date'] <= end_timestamp)]

monthly_data['date'] = monthly_data['date'].dt.to_period('M')

merged_data = pd.merge(merged_df, monthly_data, on=['ticker', 'date'], how='inner')
merged_data = merged_data.dropna(subset=['date'])

merged_data = merged_data.drop_duplicates()
conn.close()
Then I merged all of those data and clean them and generate those variables I really need.
data = data.assign(
    only_trump=lambda x: np.where((x['sponsored'] == 'Trump'), 1, 0),
    only_harris=lambda x: np.where((x['sponsored'] == 'Harris'), 1, 0),
    only_republican=lambda x: np.where((x['party'] == 'Republican'), 1, 0),
    only_democratic=lambda x: np.where((x['party'] == 'Democratic'), 1, 0),
    trump_harris = lambda x: np.where(x['sponsored'] == 'Trump, Harris', 1, 0),
    both_parties = lambda x: np.where(x['party'] == 'Republican, Democratic', 1, 0),
    sentiment = lambda x: np.where(x['party'] == 'Republican', x['sentiment_repub'],
                                   np.where(x['party'] == 'Democratic', x['sentiment_democ'], 0)
                                  )
)
# missing data
data[individual_controls + ['ret']] = data.groupby('permno')[individual_controls + ['ret'] ].transform(lambda x: x.fillna(x.mean()))
data = data.dropna()

data['log_at'] = np.log(data['at'])
data['lt_over_at'] = data['lt'] / data['at']
data['Asset_Turnover_Ratio'] = data['revt']/data['at']
data['roe'] = data['ni']/(data['at'] - data['lt'])
data['log_che'] = np.log(data['che'])
6.3 Regression
I use two-way fixed effect model to find the relationship between the political stance of CEO and monthly return during the election. The model is as follows:

The result is as the following table. It means the influence on monthly returns of people who hate or like democratic is more significant than that of republican.
| (1) | (2) | (3) | (4) | (5) | (6) | |
|---|---|---|---|---|---|---|
| Republic | 0.0063 | 0.0046 | 0.0063 | 0.0067 | ||
| (1.397) | (1.472) | (1.3988) | (1.4729) | |||
| Democratic | 0.0030** | 0.0036** | 0.0030** | 0.0035** | ||
| (2.4665) | (2.8148) | (2.4671) | (2.8146) | |||
| Control | √ | √ | √ |
When we test the same model by using Trump and Harris:
| (7) | (8) | (9) | (10) | (11) | (12) | |
|---|---|---|---|---|---|---|
| Trump | 0.0049 | 0.0047 | 0.0049 | 0.0047 | ||
| (0.7591) | (0.7411) | (0.7596) | (0.7417) | |||
| Harris | 0.0049** | 0.0034*** | 0.0031** | 0.0034*** | ||
| (1.9467) | (2.1014) | (1.9465) | (2.1012) | |||
| Control | √ | √ | √ |