By Group "NullPointer"
Title: The Impact of the US Election on Stock Prices
Date: 2025-02-22 10:00
Author: NullPointer
Category: Finance
Tags: 2024 election, stock market, NLP, sentiment analysis
Selecting a Theme
At the start of our research, we considered two potential themes for our NLP project. The first is the Hong Kong Labour Department’s Working Holiday Scheme, which enables Hong Kong youth to live and work abroad, offering a dataset of participant experiences. The second focuses on topics related to the 2024 US Election. While the first theme provides a smaller dataset for text analysis and has a less direct connection to financial markets, the second offers broader data and stronger ties to stock market impacts. Ultimately, we chose to focus on the 2024 US Election.
Introduction and Main Purpose
The US presidential election is a globally significant event with a profound impact on financial markets. Our project aims to examine the relationship between the US election and the stock market. We will explore how social and political developments during the election period influence stock market fluctuations.
Our project leverages NLP techniques to perform sentiment analysis, aiming to predict election trends and establish a link between election outcomes and typical stock price fluctuations. Specifically, we have selected Tesla as the focus stock for our research.
Data Sources
To conduct our NLP research, we collected data from the following two platforms:
- We chose an open-source dataset from USC, which compiles all comments related to the 2024 US Election from May 2024 to October 2024.
- We gathered data on supporters who raised funds for the Democratic and Republican parties from OpenSecrets. Then, we collected stock price data for related companies from Yahoo Finance, covering May 2024 to October 2024, to observe the company performance during this period.
Research Methods
With those reliable data source support, we conduct our research using the following methods to analyze fluctuations in the stock market:
- Sentiment Analysis: We apply NLP techniques, including Naive Bayes, to classify election-related comments from the USC dataset as positive, negative, or neutral, linking these sentiments to Tesla stock price movements.
- Two-Way Fixed Effects Model: We employ a two-way fixed effects model to analyze the relationship between election-related factors and relative stock price movements, using data from the USC dataset and Yahoo Finance. This approach controls for unobserved company-specific effects and time-specific effects isolating the impact of supporter funding and sentiment on stock fluctuations.
Problems we encountered
The models we tested:
- Offensive language: This is common phenomena in current social platforms, which is quite distressing. It encompasses a range of harmful behaviors, such as hate speech, cyberbullying, harassment, and spreading misinformation. To address this problem, we use a model in Hugging Face to filter them out as shown in the following code.
classifier = pipeline("text-classification", model="cardiffnlp/twitter-roberta-base-offensive")
- Sentiment Analysis: To assess the sentiment of the tweet post, we use the following Hugging Face model:
sentiment_analyzer = pipeline("text-classification", model="cardiffnlp/twitter-roberta-base-sentiment-latest")
- Sarcasm Detection: One important aspect of the sentiment analysis is the detection of sarcasm, which will be quite misleading for the subsequent analysis. Again, we use the following Hugging Face model:
irony_detector = pipeline("text-classification", model="cardiffnlp/twitter-roberta-base-irony")
The issue:
The models above are having a hard time doing their respective task. For example, in one post: "When you look at it, king Benjamin Netanyahu is the man in charge of the United States right now. Netanyahu has gotten more bills passed in the United States than what Joe Biden has achieved in the last 10 months." The subject of the sarcasm is Biden, however, the model failed to detect it.
In another example, "@NahBabyNah Climate activists attempted to disrupt a congressional baseball game, but it didn't go as planned. It just goes to show that even well-intentioned protests can sometimes backfire. #Trump2024". Here the protest was mocked via blaming the climate protesters bt a Trump supporters.
The key of the problem is, to detect sarcasm and other complicated sentiments, many aspects should be taken into account like the political party and the standpoint of the people who posted. This complicated task can not be ahcieved without Large Language Models, because LLM has stronger recognition capabilities. Its main advantage lies in the ability to artificially direct it to associate (by taking the holistic context into account, making it more accurate) and to simultaneously recognize multiple subjects. For example, in traditional deep learning, when a sentence has multiple subjects and mentions both Biden and Trump, it is difficult to pinpoint the emotions to either of them. But LLM can do it, so this is the method we adopted in the subsequent analysis.
LLM Analysis
Data Sampling
Since there are 33 million posts, which is simply unpractical to feed them all into the LLM. We randomly sample 1%, and that is 400 thousand posts in total. The 1% balances between the sufficiency of data and the practicality.
LLM Application
The LLM we select is Tongyiqianwen, and we will use the "qwen-max-latest" model, as shown by the following:
 response = await client.chat.completions.create(
        messages=[
            {"role": "user", "content": question}
        ],
        model="qwen-max-latest",
    )
Results and format transformation to JSON
After applying the LLM model, the results will be transformed to the format of JSON as shown in the following for analysis:
To collect the results from the LLM:
# Results Collection
    result = response.choices[0].message.content
    global each_json_result
    each_json_result = result
Then transform the results to JSON format:
    # Attempt to transform to JSON
    try:
        json_match = re.search(r'```json\n({.*?})\n```', result, re.DOTALL)
        if json_match:
            json_str = json_match.group(1)
            json_result = json.loads(json_str)
        else:
            print(f"Failed to extract JSON from response: {result}")
            json_result = None
    except json.JSONDecodeError:
        print(f"Failed to parse JSON from response: {result}")
        json_result = None
Problems Fixed
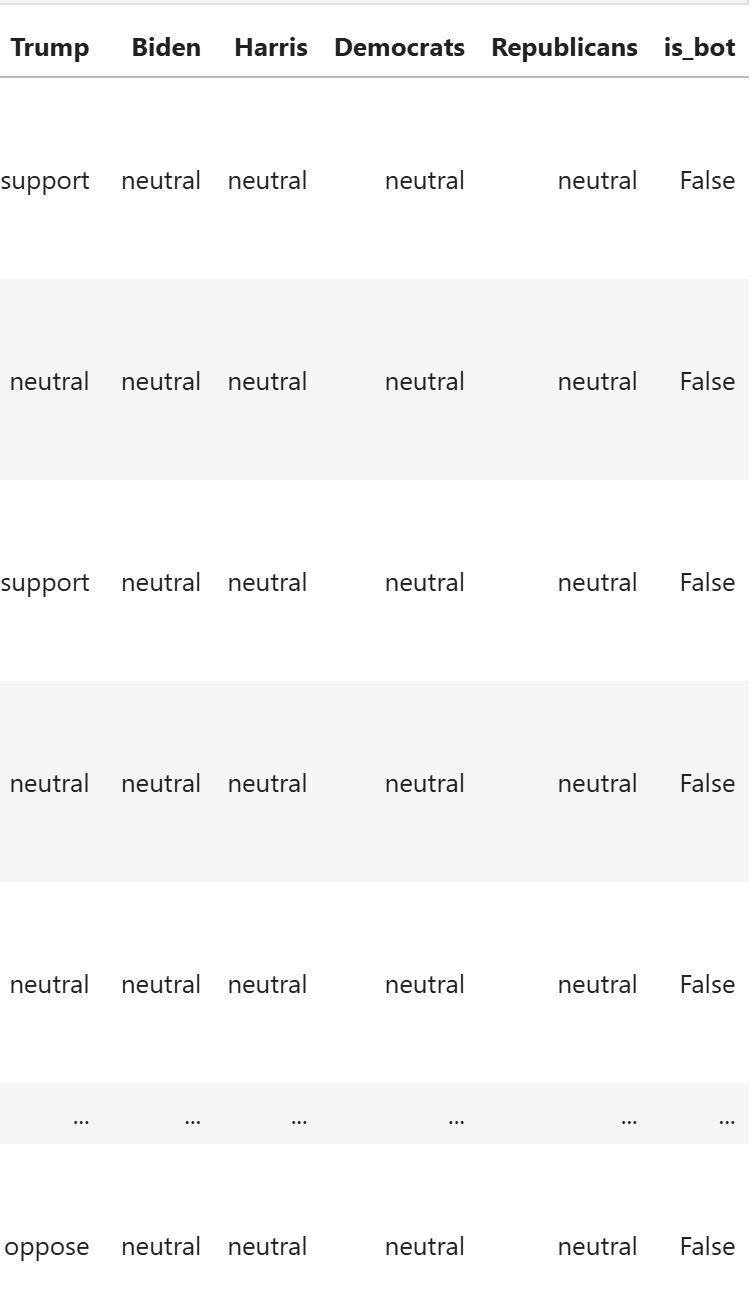
To address the previously mentioned problems of the Hugging Face model, first determine whether a tweet was posted by a bot (false/true). Second, for sentiment analysis, there are 3 criteria: positive, negative, or neutral.
Next we assign the sentiment classification analyzed from the LLM towards Trump, Biden, and Haris and their respective party and robot detection to each post via the following code:
   df['Trump'] = df['analysis'].apply(lambda x: x['sentiment']['Trump'])
df['Biden'] = df['analysis'].apply(lambda x: x['sentiment']['Biden'])
df['Harris'] = df['analysis'].apply(lambda x: x['sentiment']['Harris'])
df['Democrats'] = df['analysis'].apply(lambda x: x['sentiment']['Democrats'])
df['Republicans'] = df['analysis'].apply(lambda x: x['sentiment']['Republicans'])
df['is_bot'] = df['analysis'].apply(lambda x: x['is_bot'])
df
From the result, there is clear stance of the post towards each party and their leaders, also the verdict on whether the post was sent by a bot, as shown by the following picture.

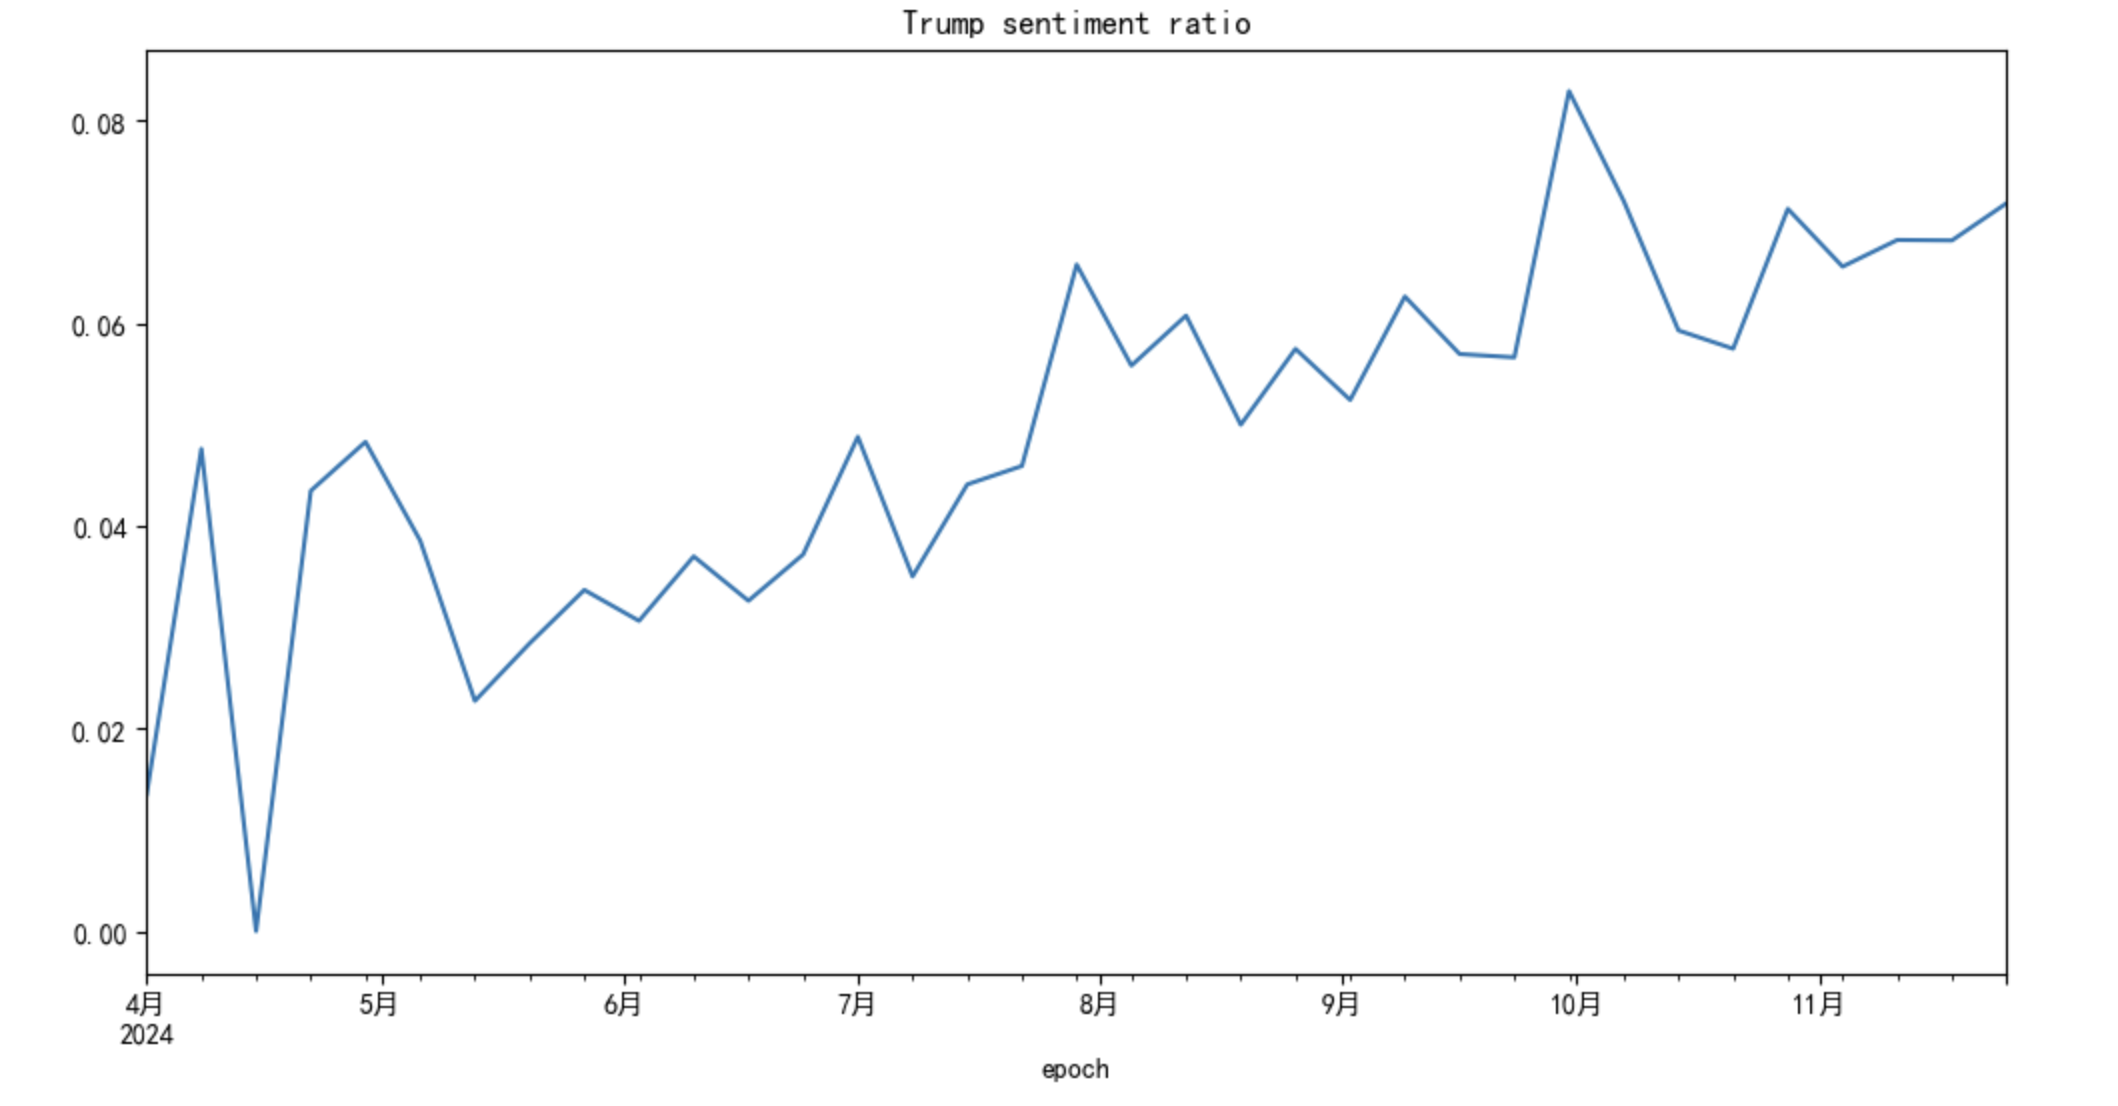
Furthermore, it will be more helpful to plot the sentiment ratio for the leaders along the time
For Trump, with the following code,
df.set_index("epoch")['2024-04-01':]['Republicans'].resample('7d').apply(
    lambda x: (x=='support').sum()/(x!='support').sum() if (x!='support').sum() else None
).plot(figsize=(12,6),title='Trump sentiment ratio')

What we can clearly see is the support for Trump gradually increases in time, although with minor fluctuations in 2024.
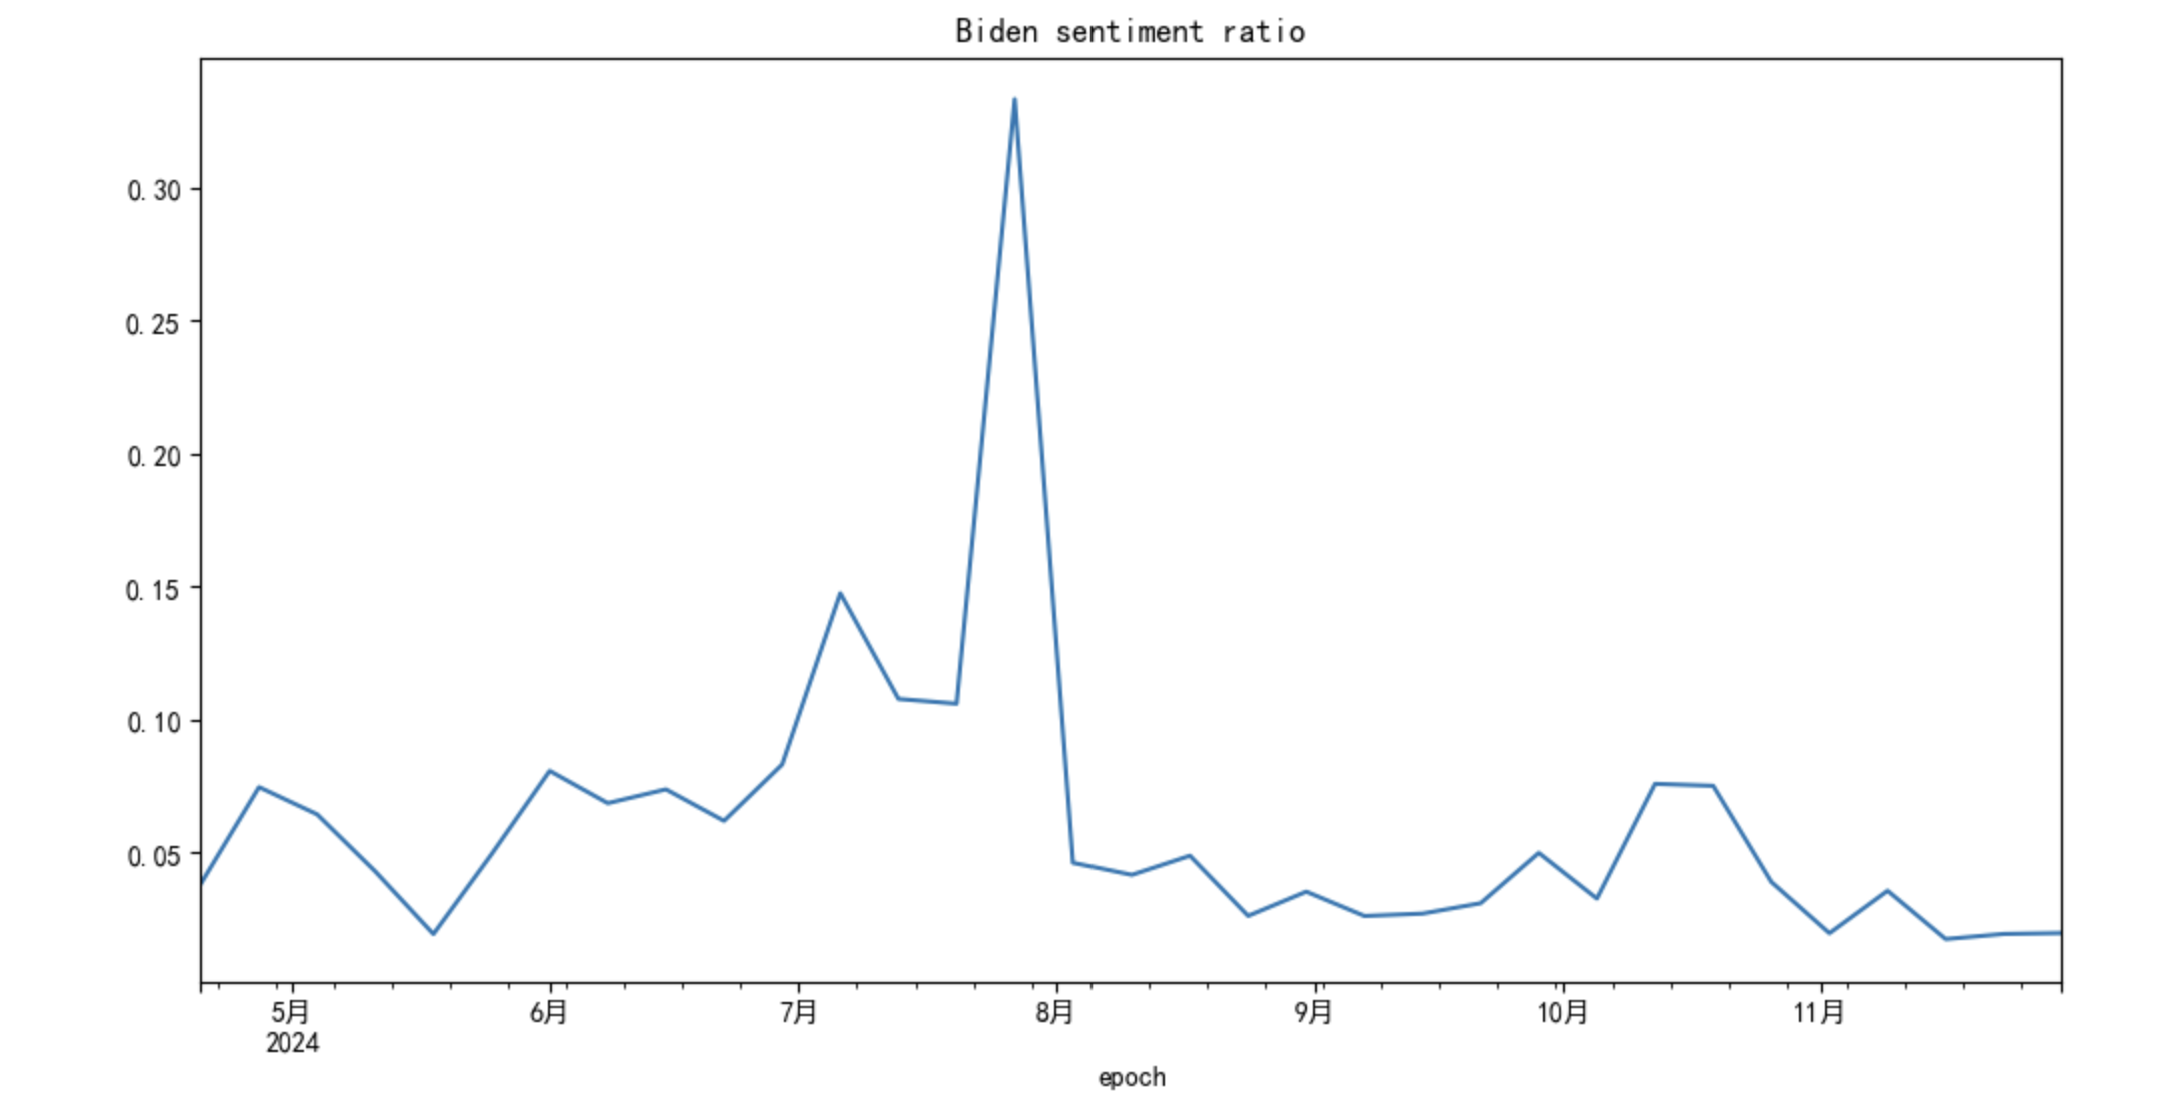
For Biden, with the following code,
df.set_index("epoch")['2024-04-20':]['Biden'].resample('7d').apply(
    lambda x: (x=='support').sum()/(x!='support').sum() if (x!='support').sum() else None
).plot(figsize=(12,6),title='Biden sentiment ratio')

What we can see is the support for Biden peaks in August, 2024 and aside from that period, the support is
Next Stage
With the sentiment analysis of the posts finished, next we will proceed to analyze how the change in sentiments affected the stock price.