Sentiment Score
We have rated the cleaned MD&A and Risk Factor, obtaining positive, neutral, and negative scores respectively. Our Sentiment Score is based on FinBert, which in turn is based on Bert. FinBert is an open-source, pre-trained NLP model that has been specifically trained on Financial Data, and it outperforms almost all other NLP techniques for financial sentiment analysis.
 FinBert principle
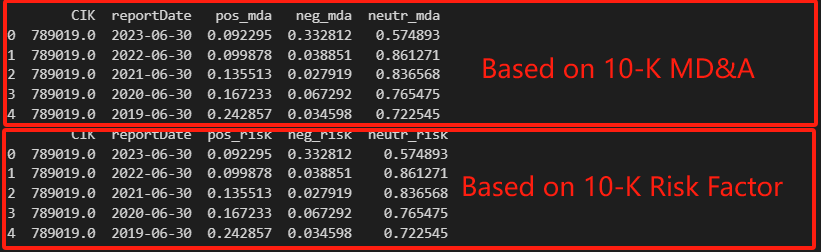 This figure shows an example based on the Sentiment Score of MD&A and Risk Factor.
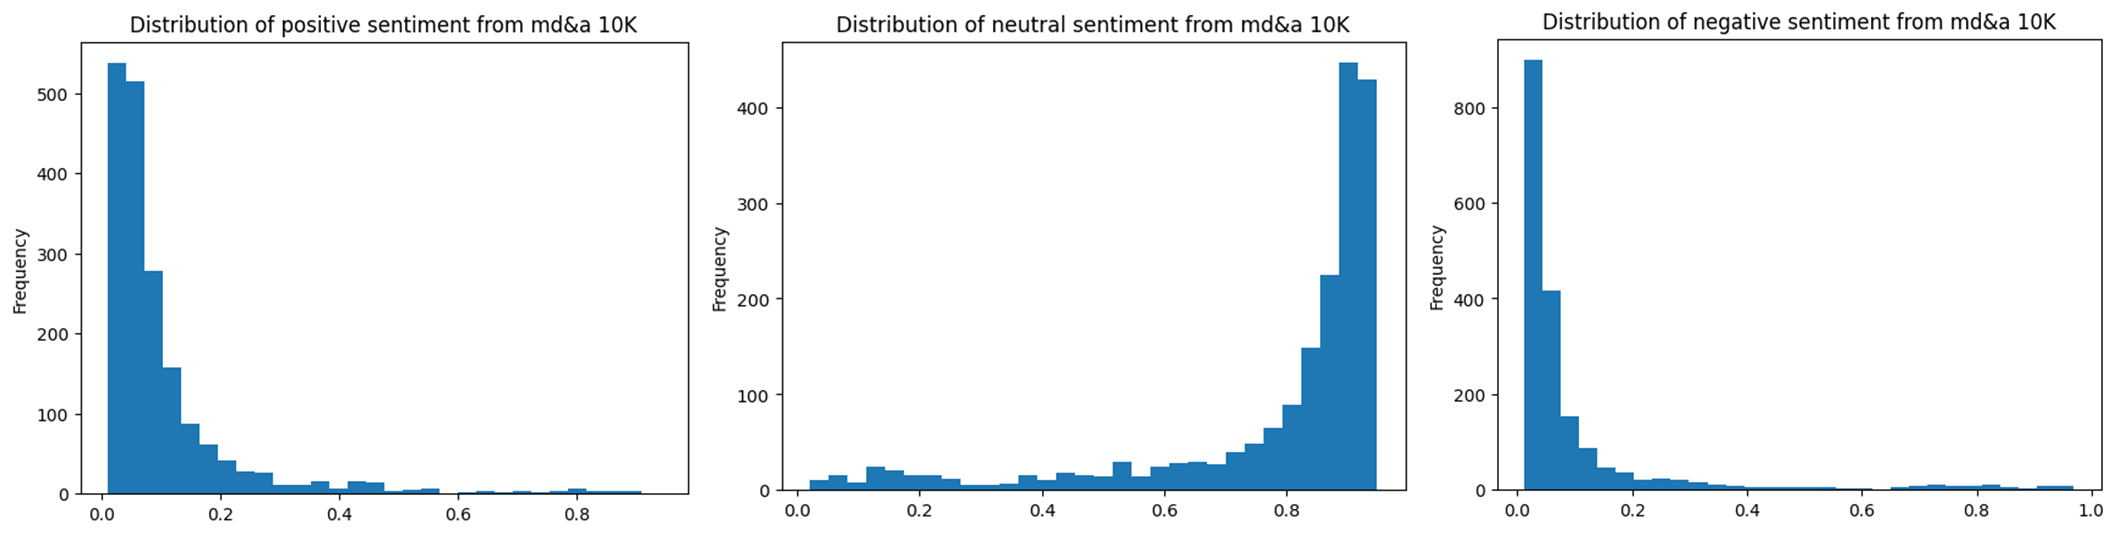 For MD&A: We have visualized all the results and found that the scores for positive and negative sentiment score are mostly close to 0, with only the neutral scores being higher. This means that most of the text has been rated as neutral.
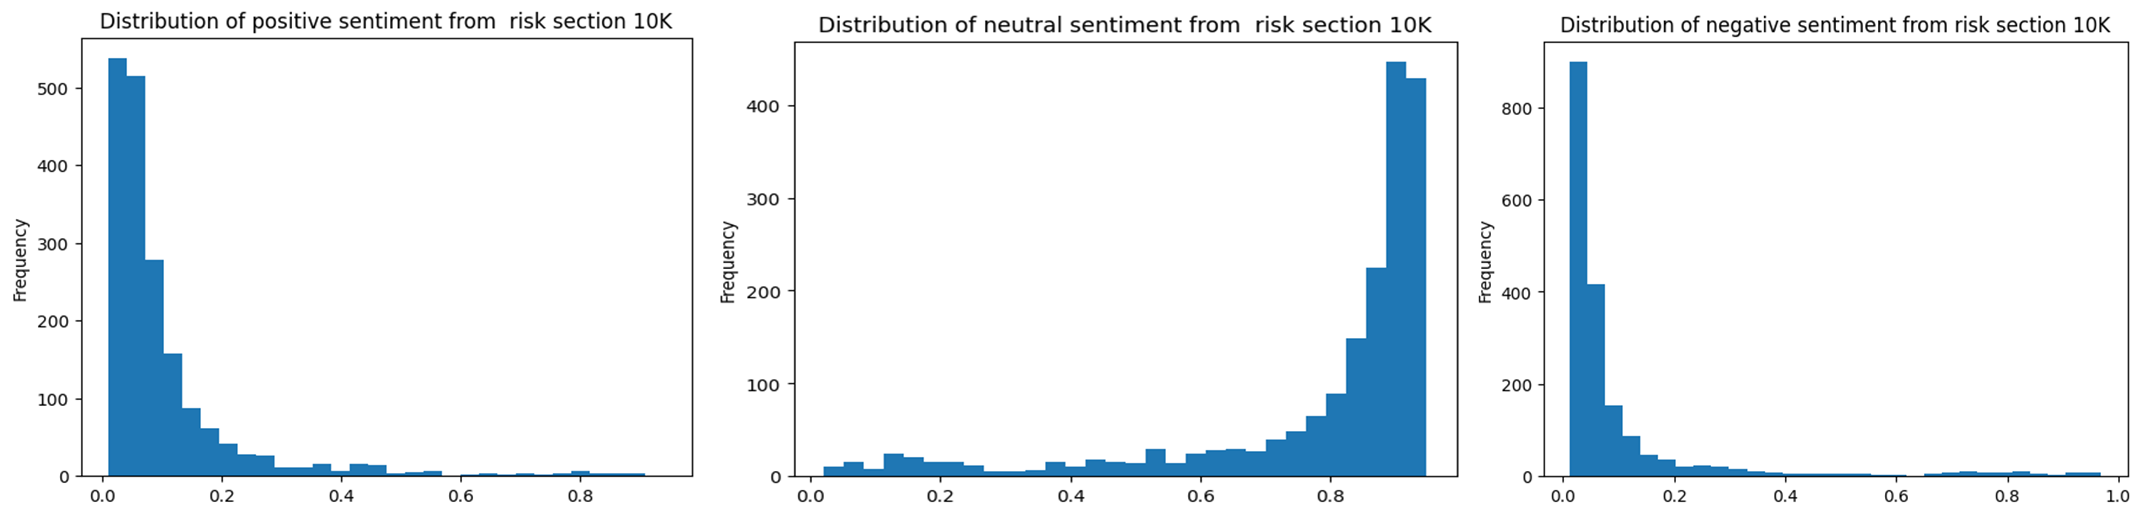 For Risk Factors: The results are almost identical to those of MD&A, with the majority of sentiment score being neutral.
Neural Network
We utilized the Neural Network Package from Tensorflow for our analysis. The input features for our model included the Sentiment Score from the MD&A and Risk Factor, as well as the industry class. The input label was the Sigma of the Report Date Excess Return.
Our hypothesis was that a higher positive (or higher negative) Sentiment Score would correspond to a higher (or lower) Report Date Excess Return. We also hypothesized that the industry class could act as a magnifier. For instance, a tech company with higher volatility could potentially transfer this to return. We considered trying Beta for this analysis.
We initially tried a Neural Network Classifier, which returned an accuracy of 80%. However, it predicted a large number of them as Neutral.
Upon further analysis, we discovered the effect of an imbalanced dataset on our results. To address this, we implemented solutions such as Synthetic Minority Over-sampling Technique (SMOTE) and Class Weighting. However, these methods only returned an accuracy of 40%
Portfolio
We have created an overall histogram for the period from 2008 to 2024.
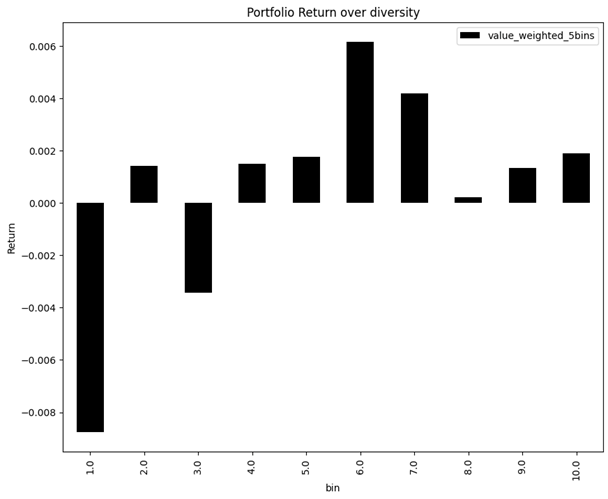
In our analysis, we created a new variable using the formula [(Positive - Negative) + (Positive - Neutral)] / 2. We then ranked these values into 10 bins.
Our strategy involved going long on the stocks in the higher bins and shorting the stocks in the lower bins. For instance, we would go long on the stocks in the 6th bin and short the stocks in the 1st bin.
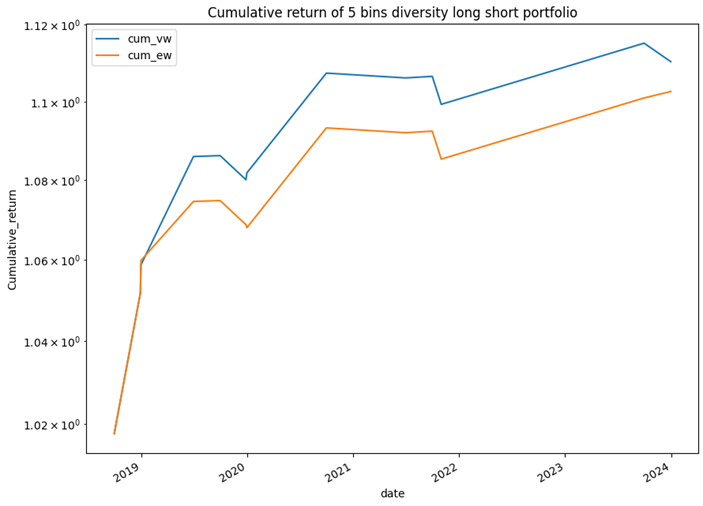
The final constructed portfolio returns
Possible Upcoming Improvement
There are two major downsides to our approach:
-
The distribution of the bins is not ascending. This means that the bin rankings do not necessarily correspond to an increasing order of stock performance.
-
Our trading strategy is based on non-frequent Earnings Reports, while our research is conducted on a daily return basis. This discrepancy could potentially impact the effectiveness and accuracy of our strategy.
Moving forward, we have identified several areas for improvement:
-
Continue Proper Documentation: We will maintain a rigorous documentation process to ensure that all steps and decisions are well-recorded and transparent.
-
Collect More Frequent Data: We aim to gather data at more frequent intervals to capture more granular trends and patterns.
-
Improve Text Pre-processing: We will enhance our text pre-processing techniques to ensure that our NLP models can extract the most meaningful insights from the text data.
-
Hyper-Parameter Testing in Models: We will conduct extensive hyper-parameter testing to optimize our models and improve their predictive accuracy.
-
Test Different Timeframe Trading Strategies: We will experiment with trading strategies over different timeframes to identify the most effective approach.
-
By focusing on these areas, we hope to refine our methodology and improve the accuracy of our predictions.