By Group "Import"
In this era of developed network technology, we are always surrounded by various kinds of information such as technology, Asia problem, political policy, and so on. We can find these information from tweets, news, blogs, etc., which may bring positive or negative impacts on the financial markets, So it makes a lot of sense to study these texts and categorize them.
Therefore, correct analysis, extracting the keywords of information, and classifying them correctly can help us better grasp the tendency of the market and gain insight into the secrets of finance.
Since a lot of people now only focus on news headlines, we think news headlines are more influential than news text. So we analyzed the headlines of the Wall Street Journal every January for the past decade extracted keywords and categorized them.
A. Data Collection
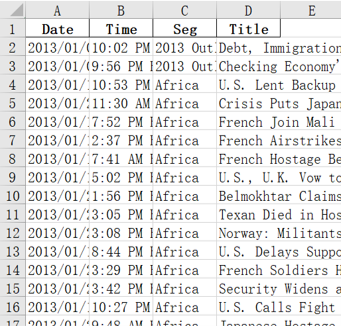
In this part, we use the GET method to download all the html files we need. Through observation, we located the corresponding part of the title and save it as a data frame. We crawled all the titles and their sections in the WSJ archive of the first month of each year from 2013 to 2022.
for i in range((end - begin).days+1):
    day = str((begin + datetime.timedelta(days=i)).strftime('%Y/%m/%d'))
    url = 'https://www.wsj.com/news/archive/' + day
    print(url)
    page = BeautifulSoup(requests.get(url, headers=headers).content, 'html.parser')

    for article in page.select('article'):
        temp = {'Date':[day], 'Time':[article.p.text], 'Seg':[article.span.text], 'Title':[article.h2.text]}
        temp_df = pd.DataFrame(temp)
        res = res.append(temp_df)
Then we began to conduct the preprocessing tasks. The news headlines often contain many emotional words and many connectives that have little to do with the content. So we introduce the custom word list into the data cleaning procedure.
B. TF-IDF Matrix
After getting the processed word set, we begin to build the TF-IDF matrix for the subsequent clustering.
The TF-IDF matrix is used for calculating the TF-IDF value, which is often used to measure the importance of a single word among some certain articles. Words that occur frequently within a document but not frequently within the corpus receive a higher weighting, cuz these words are assumed to contain more meaning.
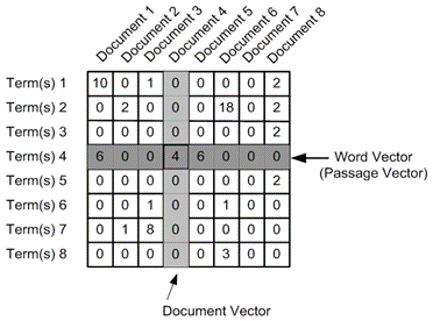
This value can illustrate the characteristics of words from another aspect rather than just simply measuring everythingwith frequency.
# build the vector and calculate the frequency
vectorizer = CountVectorizer(stop_words=None)
temp_v = vectorizer.fit_transform(words)
word = vectorizer.get_feature_names()
df_word =  pd.DataFrame(temp_v.toarray(),columns=vectorizer.get_feature_names())

# idf calculation
transformer = TfidfTransformer(smooth_idf=True,norm='l2',use_idf=True)
tfidf = transformer.fit_transform(temp_v)
df_word_tfidf = pd.DataFrame(tfidf.toarray(),columns=vectorizer.get_feature_names())
df_word_idf = pd.DataFrame(list(zip(vectorizer.get_feature_names(),transformer.idf_)),columns=['words','idf'])
C. The choice of K-means
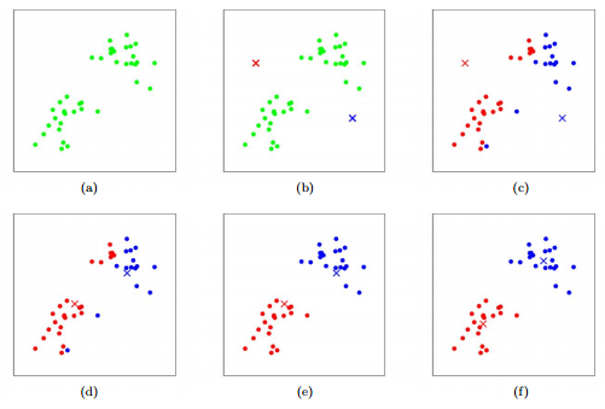
When it comes to the selection of model, we finally chose the classical K-means. As an unsupervised model, it can help us complete the classification with the solely input of the number of clusters. Faced with a large number of unknown news texts, this nontendentious prediction can help us obtain more rational results and reduce the impact of manually-set parameters. Words with relevance will be clustered into the same category. Though we restrict the number of clusterings, this does not mean that the number of words in each cluster is fixed. For some clusters with fewer words, we can clearly extract their connections from the massive text.
kmeans = KMeans(cluster_nums)
kmeans.fit(idf_value)
identified_clusters = kmeans.fit_predict(idf_value)
D. Results
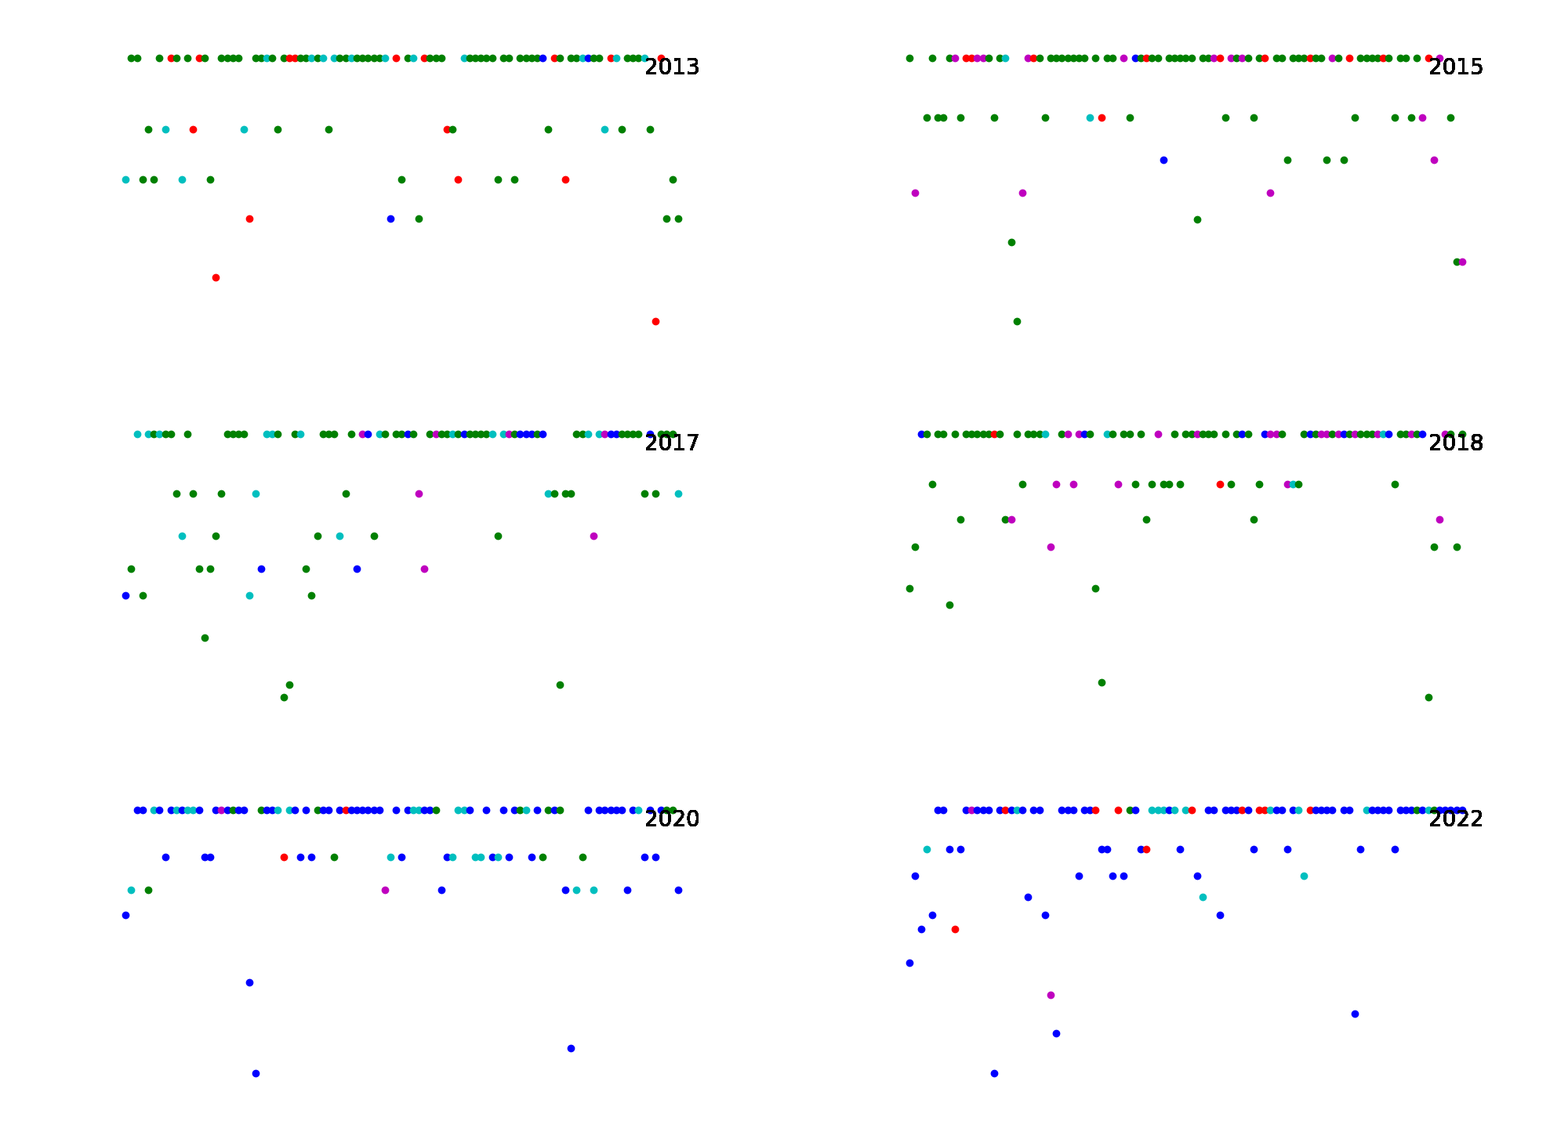
Among the results, we’ve seen some unexpected findings. This is a picture which shows the top 20 key words appearing in the news title during the past decade from 2013 to 2022. The words with the same color represent they are in the same cluster.
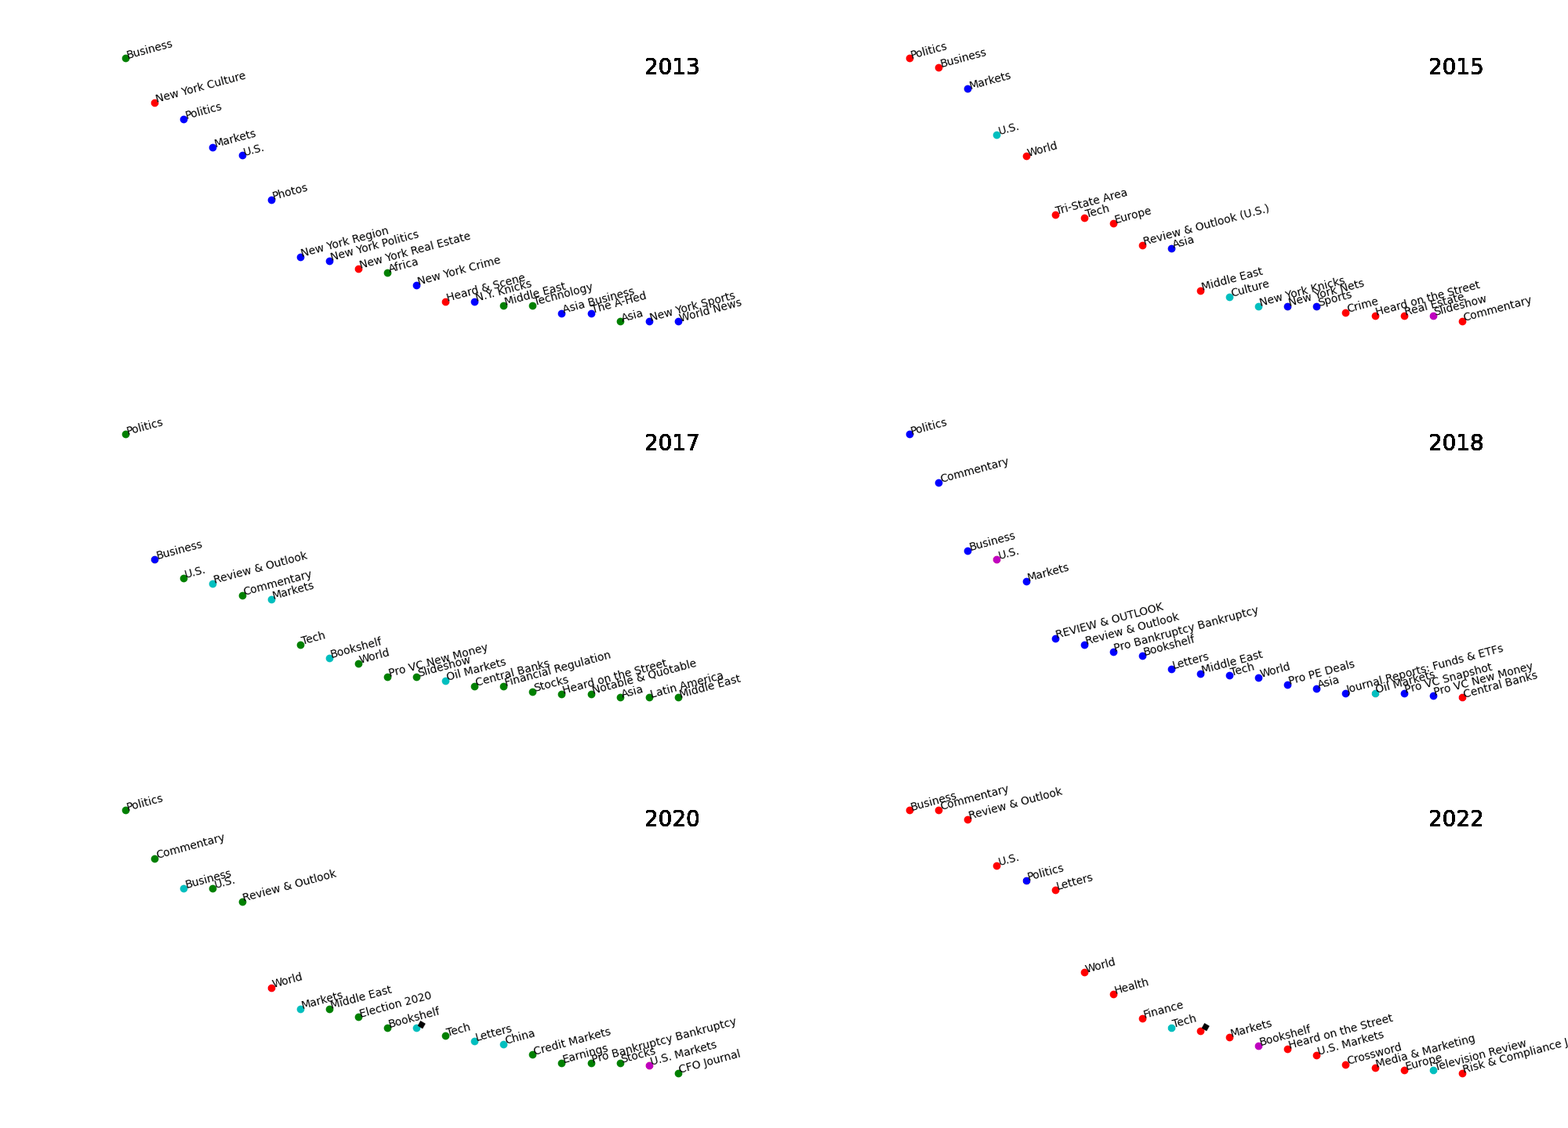
Our results showed that many words are corelated to each other. It’s not because have the similar meanings, or they are in a same bigger categories. They are totally different words but tend to has high correlation level in the statistics analysis.
E. Future Work
We are going to amend our model in the project in 3 ways. 1st, we need to be more quantified. Our model is not quantified enough although it is the most common difficulty for many nlp analysis. 2nd, the choice of K could be more accurate. Maybe we can apply elbow method to improve the way of choosing K. 3rd, including Chinese market, the emerging market are not mature enough which has higher proportion of private investors who are more easily to be affected by larger scale of information aspects. Therefore we could separate the sample into smaller groups. This also indicate our projects’ prospect and its meaning.
Thanks for reading. Have a good day. ( ͡° ͜ʖ ͡°)✧
         ┌─┐       ┌─┐
      ┌──┘ ┴───────┘ ┴──┐
      │                 │
      │       ───       │
      │  ─┬┘       └┬─  │
      │                 │
      │       ─┴─       │
      │                 │
      └───┐         ┌───┘
          │         │
          │         │
          │         │
          │         └──────────────┐
          │                        │
          │                        ├─┐
          │                        ┌─┘
          │                        │
          └─┐  ┐  ┌───────┬──┐  ┌──┘
            │ ─┤ ─┤       │ ─┤ ─┤
            └──┴──┘       └──┴──┘
Codes are far away from bugs with this mythical animal protecting
神兽保佑,代码无bug