By Group "Meta"
So far, we have completed data collection, data cleaning and most of the model building. We have completed the small sample analysis. However, the amount of text is too large, and we need to wait until the independent program mining is completed.
A. Data collection
We get 1.4 million pieces of text data from Benzinga
columns = ['title', 'date', 'stock', 'content']
Beside that we also collect the URL for future analysis
B. Text data preprocess
First we use the TF-IDF model to process our data, follow the standard work flow
- Drop symbols, numbers, and single characters
- Remove stop words
- Tokenize words
- Transform to matrix
We use AutoTokenizer command to fulfill the work flow
Part of the feature words:
['aerostructures', 'aerosystems', 'aerovironment', 'aersale', 'aes', 'aesthetics', 'aetna', 'aex', 'aeye', 'aezs', 'af', 'afer', 'afexa', 'affairs', 'affect', 'affected', 'affecting', 'affiliate', 'affiliated', 'affiliates', 'affirmation', 'affirmed', 'affirms', 'affo', 'afford', 'affordable', 'afg', 'afimoxifene', 'afl', 'aflac']
C. Factor test
1. Regression method
Regression method is one of the most commonly used methods to test the effectiveness of factors. The specific method is to conduct linear regression between the factor exposure vector in period \(T\) and the stock return vector in period \(T + 1\). The obtained regression coefficient is the factor return of the factor in the period, and the significance level of the factor return in the regression of this period( \(t\) value). The factor exposure of individual stocks in a certain cross-sectional period refers to the factor value of individual stocks on this factor at the current time. The specific expression of the regression model of phase \(T\) is as follows:
where
- \(r^{T+1}\): Return of all stocks in period \(T+1\)
- \(X^T\): Exposure vector of all stocks in period \(T\) on the tested single factor
- \(Indus_j^T\): Exposure vector (0/1 dummy variable) of all individual stocks on the \(j\) industry factor in the \(T\) period
- \(\ln\_mkt\): Exposure vector of all stocks in period \(T\) on the logarithmic market capitalization factor
- \(a^T,b^T,b_j^T\): Corresponding factor yield, constant to be fitted, usually pay more attention to \(a^T\)
Evaluation:
- The mean of the absolute value of the t-value series: an important criterion for the significance of the factor
- The proportion of the absolute value of the t-value series greater than \(2\): judging whether the significance of the factor is stable
- The mean of the t-value series: combined with 1. can judge the factor whether the positive or negative direction of the t value is stable
- The mean value of the factor return series: to determine the size of the factor return.
2. IC analysis
The IC value of the factor refers to the correlation coefficient between the exposure vector of the factor in the T period and the stock return vector in the \(T+1\) period, that is:
In the above formula, the factor exposure vector \(X^T\) generally does not directly use the original factor value, but goes through means such as de-extreme and neutralization.
In actual calculation, the use of the Pearson correlation coefficient may be greatly affected by the extreme value of the factor, and the use of the Spearman rank correlation coefficient is more robust. The IC calculated in this way is generally called the Rank IC. The IC value analysis model is constructed as follows:
- The stock pool, retrospective interval and cross-section period are the same as the regression method
- First perform a certain preprocessing on the factor exposure vector, and then calculate the Spearman rank correlation coefficient between the processed \(T\) period factor exposure vector and the \(T+1\) period stock return vector, as the \(T\) period factor Rank IC value
Evaluation:
- Rank IC value series mean value: factor significance
- Rank IC value series standard deviation: factor stability
- ICIR (ratio of Rank IC value series mean to standard deviation) : factor validity
- The proportion of the Rank IC value series greater than zero: whether the direction of action of the factor is stable
3. Stratified backtesting
Scoring stocks according to factor values and building portfolio backtests is the most intuitive way to measure the pros and cons of factors. Compared with regression method and IC value analysis, stratified test method can explore the nonlinear law of factor's prediction of income. That is, if there is a factor stratified test result that shows that the performance of the Top group and Bottom group is stably worse than that of the Middle group for a long time, then the factor has a stable nonlinear law for the prediction of income, but in the regression method and IC value analysis, the process is likely to be judged as an invalid factor.
D. Problem Encountered
Problem 1: Web-Scraping
1. Which website?
We want to focus on the articles on high-quality financial website includes both the content and titles. First, we try to find the most common and high quality website the list is Bloomberg, Wall Street Journal, SeekingAlpha, Benzinga, FastCompany, TipRanks, FXstreet, Barron's.
After careful and thorough consideration, we eliminate Wall Street Journal and Bloomberg. Because, we need to pay for the content and we still want to maintain the possibility of full text analysis. in the end even though they are professional and highly recommanded by others, we have to give them up.
Finally choose Benzinga as our target website for the following reason: 1. The text data in Benzinga can be download in company lawyer for each url correspond to one certain firm. 2. The Benzinga integrates the articles from SeekingAlpha , TipRanks, InvestorPlace and etc. this means it can help us the scraping more text with less work load.
2. Scraping problem
(1) the first scraping result is unsatisfactory , because the data is dynamic loading. In this way we can only get 14 articles
import requests
from bs4 import BeautifulSoup
url = "https://www.benzinga.com/quote/AAL"
head = {'User-Agent': "Mozilla/5.0 (Windows NT 10.0; Win64; x64) AppleWebKit/537.36 (KHTML, like Gecko) Chrome/97.0.4692.71 Safari/537.36"}

response = requests.get(url=url,headers = head)
soup = BeautifulSoup(response.text, 'html.parser')
a = soup.find_all("div", class_ = "py-2 content-headline")
list1 = []
for i in a:
    list1.append(i.text)
print(list1) # only get 14 article
(2) After adjustment we rewrite the code to scrap the dynamic data
Get the dynamic page
:authority: api.benzinga.com
:method: GET
:path: /api/v2/news?tickers=AAL&displayOutput=full&pageSize=15&page=1&token=5a3ef9a1e9ed4ce9893131ff6ff046f6
:scheme: https
accept: application/json
Code writing
nasdaq_listed = pd.read_csv('nasdaq-listed-symbols_csv.csv')['Symbol'].values
other_listed = pd.read_csv('other-listed_csv.csv')['ACT Symbol'].values
nyse_listed = pd.read_csv('nyse-listed_csv.csv')['ACT Symbol'].values

symbols = sorted(list(set(nasdaq_listed) | set(other_listed) | set(nyse_listed)))

start_date = date(2022,3,10)
end_date = date(2022,3,16)
url = "https://api.benzinga.com/api/v2/news"
params = {
    "tickers": "A",
    "displayOutput": "full",
    "pageSize": "15",
    "page": "0",
    "token": "91741717e18e45a9ac4701d3cb8b7ed4"
}


headers = {
    'origin': 'https://www.benzinga.com',
    'referer': 'https://www.benzinga.com/',
    'user-agent': 'Mozilla/5.0 (Windows NT 10.0; WOW64) AppleWebKit/537.36 (KHTML, like Gecko) Chrome/70.0.3538.25 Safari/537.36 Core/1.70.3741.400 QQBrowser/10.5.3863.400'
    }


NewsCreateTime_list = []
NewsTitle_list = []
NewsStock_list = []

for stock in symbols:
    params['tickers'] = stock
    page = 0

    # end_stock = 1 leads to the end of searching a stock
    end_stock = 0

    while end_stock == 0:

        params['page'] = str(page)

        res = requests.get(url, params=params, headers=headers)
        xml_dict = xmltodict.parse(res.content)
        NewsDict_list = xml_dict['result']['item']

        for NewsDict in NewsDict_list:
            create_time_str = NewsDict['created']
            create_time = datetime.strptime(create_time_str, '%a, %d %b %Y %H:%M:%S %z')

            if create_time.date() < start_date:
                end_stock = 1
                break
            elif create_time.date() > end_date:
                continue

            NewsCreateTime_list.append(create_time.strftime('%Y-%m-%d %H:%M:%S%Z').replace('UTC', ''))
            NewsTitle_list.append(NewsDict['title'])
            NewsStock_list.append(stock)

        page += 1

result_df = pd.DataFrame({
    'Article headline': NewsTitle_list,
    'date': NewsCreateTime_list,
    'stock': NewsStock_list
})

result_df.to_csv('./analyst_ratings_processed.csv')
Problem 2 : About BoW model
1. The application of TF-IDF model
(1) The denominator of idf may equals to 0
In chapter 16 about the TF-IDF calculation, the standard calculation method has some problem in application. The
may equal to 0 sometimes. So in the Sklearn working document, they modify the equation.
we use smooth_idf=True to adjust the TF-IDF model. The calculation formula is
(2) The loss of sequent information
In text analysis TFIDF can't contain the sequent information of text, but N-grams can help contain all the information the first n-1 words can provide. However, this will produce most words without grammatical and semantic meaning, forming too much noise, which is not good for training.
(3) Other problems
TFIDF also has the problem of ignoring the deviation of the categories from the previous distribution of the categories.
For example: word 1 appears 100 times in class 0 and 10 times in class 1; word 2 appears 10 times in class 0 and 100 times in class 1, word 1 and word 2 have the same tfidf value, so the TFIDF matrix cannot reflect the word The importance of 1 in 0 category.
Solution: Use BERT model to do text analysis
(i) regular expression: expanded for some abbreviations (e.g., “can't” to “can not”)
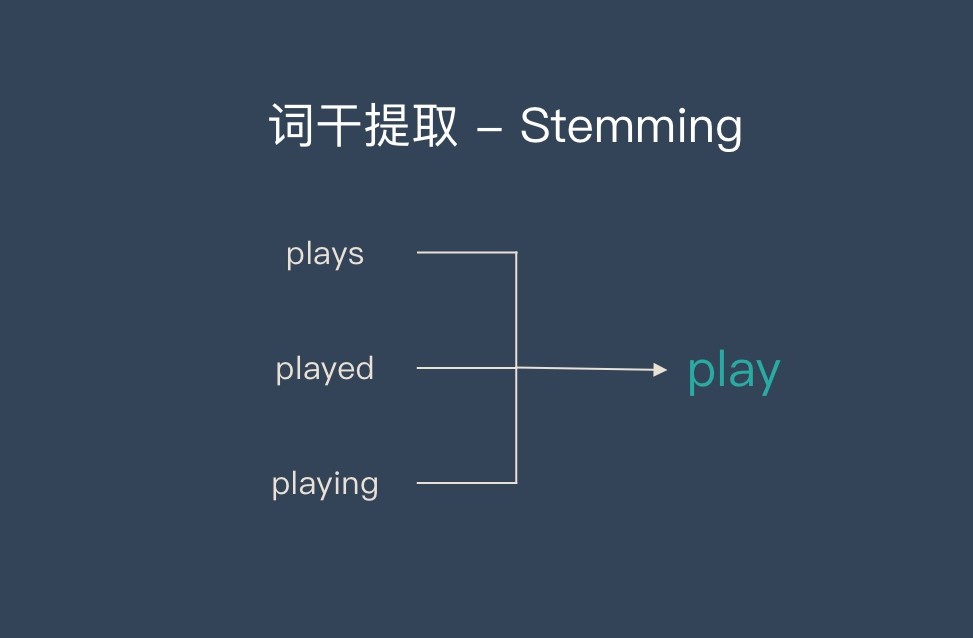
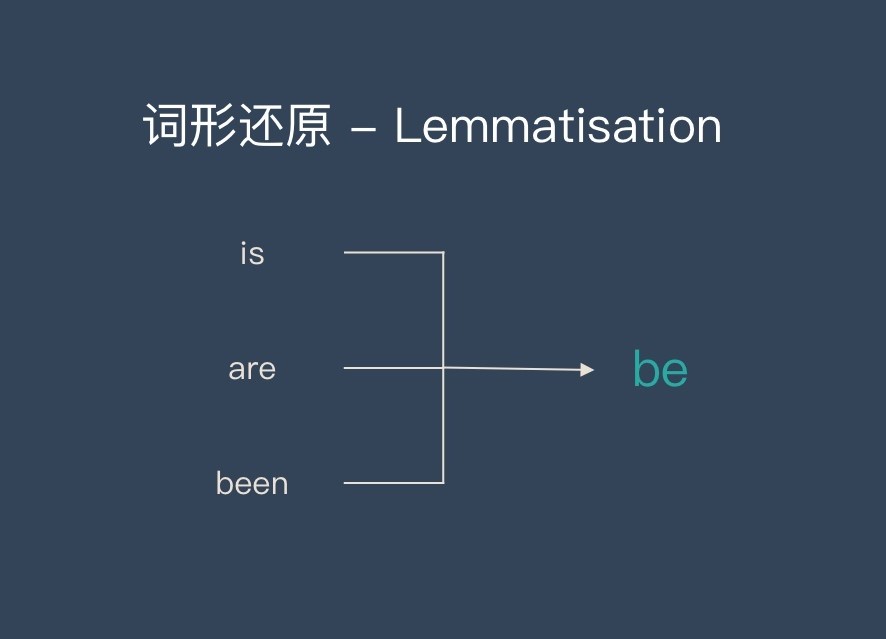
(ii) The purpose of stemming and lemmatization is to unify words composed of different letters but have the same meaning, so as to facilitate the establishment of a bag-of-words model.
but there are minus difference between this two methods
Stemming: Keep the root, suitable for the field of information retrieval. But the grain of this model is coarse

Lemma: Finer-grained, more accurate text analysis and representation
