By Group "Four Guys"
Exploring the power of sentiments in earning calls
In the fast-paced world of finance, earnings calls serve as a critical bridge between companies and their stakeholders. In these meetings, company executives discuss financial results, strategic priorities, and future outlooks, which generate a wealth of unstructured textual data. It is not just about reporting numbers like revenue and profits, they also craft narratives with words that project confidence or on the other hand, show hesitations and risk. Hence, our group is interested in finding out possible relationships between these unspoken cues and its stock price movements.

With advancements in natural language processing, we can now quantify this sentiment and explore its tangible impact on financial markets.
By analyzing management’s tone (positive, negative, or neutral) and correlating it with post-call stock returns, we aim to answer two key questions:
-
Does a positive sentiment in earnings calls correlate with stock price increases, and does negative sentiment precede declines?
-
Can sentiment analysis serve as a reliable predictive tool for investor decision-making?
In order to test our hypothesis, we will have to explore and gather these data:
- Earnings call transcripts: from S&P 500 companies over the past years
- Stock price data: Daily closing prices for the same companies, specifically focusing on 1-day and 1-week post-call windows to capture short-term market reactions.
- Alignment: Precise pairing of transcripts sentiments with their corresponding stock return calculations to ensure accurate analysis.
To initiate our project, the first step is undoubtedly data collection. This step is critical in the data workflow, as the quality of our data directly influences all subsequent processes. If we begin with subpar input, the output is unlikely to be much better. In addition to data quality, we must also consider the cost of obtaining information.
“Garbage in, Garbage out” ~ George Fuechsel, an IBM programmer
For our data mining efforts, we require a substantial number of earnings call transcripts from various companies and different time periods. Ideally, we are seeking a freely accessible database with API available. However, our research has indicated that most high-quality databases come with significant subscription fees, which adds to the overall cost of information acquisition, as shown in the following table.
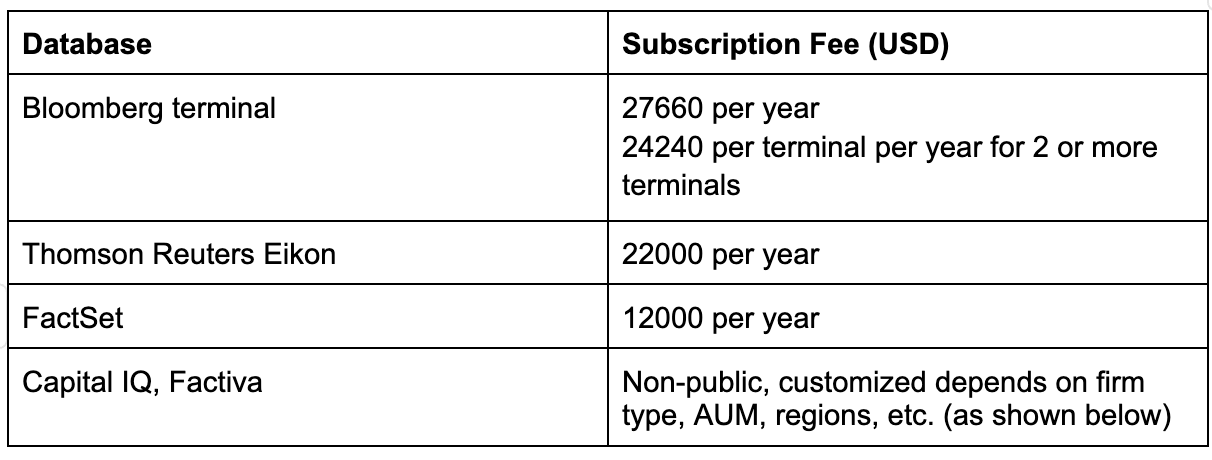
For some platforms, such as FactSet, while free trials may be available, they typically have limitations, either in duration or by requiring detailed company information to access.
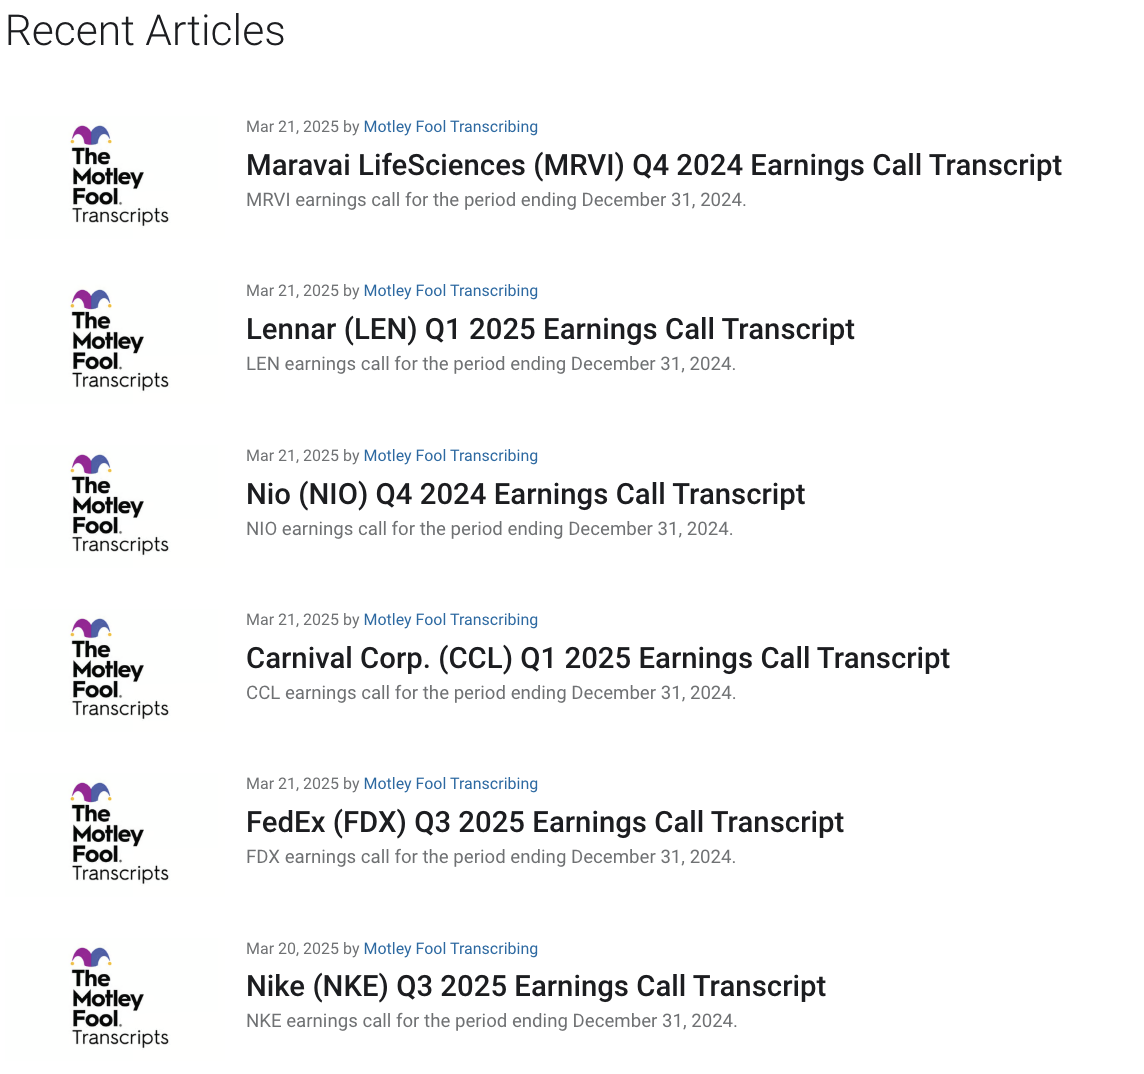
We have discovered a free database provided by the Motley Fool that offers earnings call transcripts. However, there is no official API available. We have decided to develop our own scraper to efficiently download a large number of earnings call transcripts.
1. Scraping Links to Transcripts
results = []
for i in tqdm(range(1, 500)):
    params = {'page': f'{i}'}
    response = requests.get(
        'https://www.fool.com/earnings-call-transcripts/filtered_articles_by_page/',
        params=params, cookies=cookies, headers=headers
    )
    soup = BeautifulSoup(response.json()['html'], 'html.parser')
    links = soup.find_all('a', class_="flex-shrink-0 w-1/3 mr-16px sm:w-auto")
    results.extend([f"https://www.fool.com{link.get('href')}" for link in links])
We used BeautifulSoup and python Requests to scrap and stores 500 webpages of links that points to past transcripts from the Motley Fool’s archive. Each page is then stored in Redis for caching. We are using pandarallel for parallel processing in later parts to scrap transcripts from each link efficiently, and Redis is initialized for our data pipeline.
2. Get list of S&P 500 tickers, extract price data and calculate stock returns
price = yf.download([i for i in df.stock_code.unique() if i in s_p.Symbol.to_list()], period='4y')

def get_stock_returns(row, days):
   start_loc = None
   if row.stock_code not in price.columns:
       return None
   else:
       if row['datetime'] in price.index:
           start_loc = price.index.get_loc(row['datetime'])
       else:
           for i in range(1,4):
               idx = row['datetime'] + datetime.timedelta(days = i)
               if idx in price.index:
                   start_loc = price.index.get_loc(idx)

       if start_loc is None:
           return np.inf
       s = price.iloc[start_loc : start_loc + days + 1][row.stock_code]
       if len(s) < days:
           return np.inf
       return (s.iloc[-1] - s.iloc[0]) / s.iloc[0]
After extracting the transcript, stock ticker and date, we merge them into a dataframe. We then extract a list of S&P 500 companies and extract their price data from Yahoo Finance by bulk downloading all stock codes into the dataframe using only the closing price. The get_stock_returns function takes each transcript (row), then obtain the prices of that stock in the next few days and obtain its 1-to-7 day returns. If one of the day is not a trading day, then it shifts onto the next trading day.
3. Sentiment Analysis
analyzer = SentimentIntensityAnalyzer()

# Define a function to compute sentiment score from text.
def compute_sentiment(text):
    # If text is NaN, return np.nan
    if pd.isna(text):
        return np.nan
    sentiment = analyzer.polarity_scores(text)
    # Use the compound score which summarizes overall sentiment.
    return sentiment['compound']

# Next, we will calculate the correlations between the sentiment score and the return columns.
# List the columns that represent returns:
return_columns = [f"{i}_day_return" for i in range(1, 8)]

# We'll add 'sentiment' to the list for correlation analysis.
columns_of_interest = ['sentiment'] + return_columns

# Apply sentiment analysis on the transcript text column
df['sentiment'] = df['cleaned_data'].parallel_apply(lambda x: TextBlob(x).sentiment.polarity)

# Calculate the correlation matrix for these columns.
corr_matrix = df[columns_of_interest].corr()
After establishing the data pipeline (collecting, cleaning and pre-proecssing), we now start to analyse sentiment based on the earning calls transcript text and summarizing the overall sentiment using the pre-trained sentiment analysis model from the Vader module. After which we calculate the correlations between sentiment score and the stock reutrn columns (1-to-7 days) and visualize using a correlation matrix and heatmap. The heatmap which can be seen below.
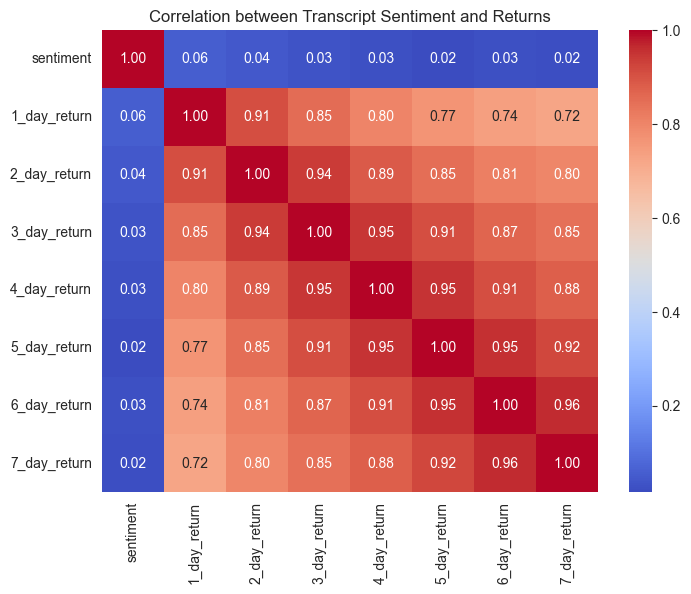
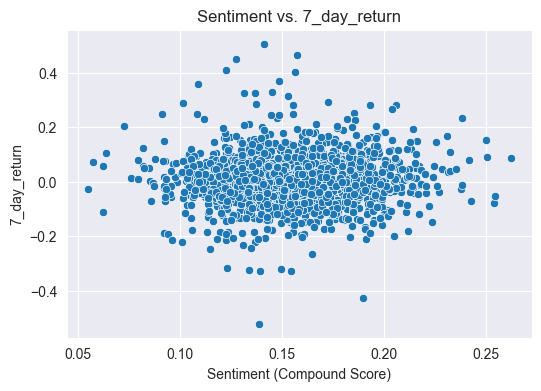
The scatterplot and the correlation heatmap suggests a low correlation between returns and the sentiment score calculated by this method. We will explore other analyzers in thhe future and see if more information can extracted.