I want to estimate and predict a company’s sales using Natural Language Processing (NLP) and machine learning to analyze its financial statements.
April 3
I choose Coca-Cola Co (KO) for 2 main reasons. First, it is a worldwide food company listed on the Dow Jones Industrial Average. Second, its stock price fluctuates, so it is easier to estimate the impact of financial statements on different growing patterns.
I download its quarterly reports (10-Q & 10-K) on SEC EDGAR from 1998 to 2002 and save them as “.txt” files.
I use NLTK package to tokenize them and remove stop words. I use Pandas to merge data frames, lower case, and use regular expression. It is also easy to compute Bag-of-Words (BOW) using groupby and count.
# Lower case
'APple'.lower()

# Tokenize
from nltk.tokenize import word_tokenize
word_tokenize('apple banana')

# All stop words
from nltk.corpus import stopwords
stopwords.words('english')

April 4
I download the same reports from 1994 to 1997. Three 10-K files (1994-1996) are downloaded on the company's website.
I downloaded quarterly sales data on Bloomberg from 1993 to 2022. There is no sales for 2001Q4, so I substitute it with the average of 2001Q3 and 2002Q1.
April 13
I use unsupervised learning to analyze BOW. I use k-means clustering and hierarchical clustering in SKLearn package. There are 36 quarters in total. I try from 2 to 8 clusters. The outcomes are not desirable.
from sklearn.cluster import KMeans
import matplotlib.pyplot as plt

# Fit k-means model
k_clust = KMeans(n_clusters=3, random_state=23).fit_predict(df)

# Visualize the relationship
plt.scatter(x=k_clust, y, c=k_clust)

# The code for supervised learning is very similar, can check sklearn documentations
April 17
I use supervised learning to analyze BOW. I put 28 quarters (80%) in the training set and 8 quarters in the test set. I classify the outcome variable sales growth into 2 / 3 / 4 classes. I use Naïve Bayes, logistic regression, and Random Forest classifier. And I compute the predictive accuracy correspondingly.
# Train-test split
from sklearn.model_selection import train_test_split
x_train, x_test, y_train, y_test = train_test_split(x, y, test_size=0.2, random_state=24)
I also use linear regression and Random Forest regressor for the continuous outcome variable sales growth and compute square root of mean squared error (RMSE) correspondingly.
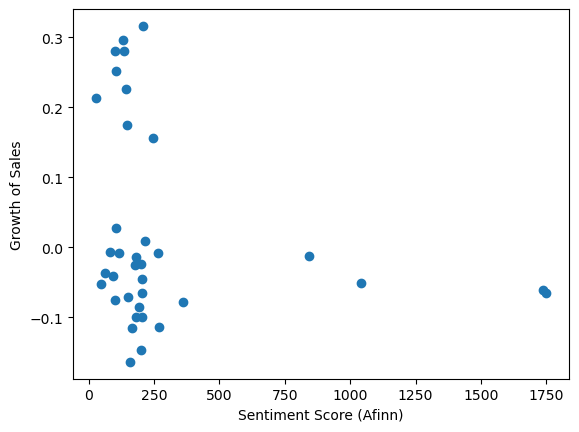
I calculate the sentiment score for each quarter using Afinn lexicon. There is no significant relationship between sales growth and sentiment score.
from afinn import Afinn
Afinn().score('love')

I use NLTK package to stem and lemmatize after excluding stop words and before calculating BOW.
from nltk.stem import PorterStemmer
PorterStemmer().stem('lovely')
At night, I start to make the first vision of presentation slides, and I finish on the morning of Apr 18.
April 18
I manually calculate tf-idf using Pandas on BOW. Then I input it into all models. There is no increase in performance. 2 references: Wikipedia, Baike.
My teacher advises me to include more details in the slides. So I work on covering more intuition.
April 29
After the presentation on Apr 24, my teacher advises me to look into a certain quarterly statement as a case study.
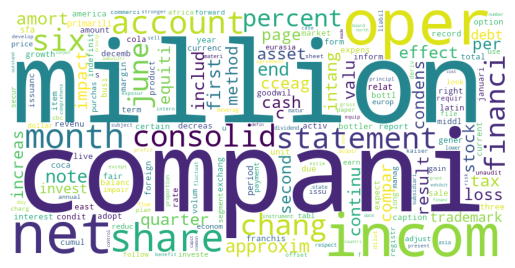
I select the quarter with the highest sales growth. I use my trained RF regressor model to predict its sales growth. I filter 10 most frequent words. I plot a word cloud.
from wordcloud import WordCloud
WordCloud().generate('apple, banana, apple')

April 30
For supervised learning, I add 2 models: XGBoost regressor and XGBoost classifier.