By Group "Simplicity," written by Puri Dev Lalit (Dev)
Author Introduction
I am Dev, a Year 2 student majoring in Quantitative Finance at HKU, and I am in charge of two parts, namely (1) Analyzing post sentiment and (2) Updating it according to the overall popularity of the post.
Initial Thoughts
I was aware of the fact that there are several Python libraries for Sentiment Analysis, such as pre-built ones like TextBlob and VADER, or trainable ones like keras. I took a look at my dataset and thought a bit about the nature of the text I was trying to analyze - Reddit posts. They would most likely be full of colloquialisms, acronyms and even emojis. It would be out of my area of competence, and take an enormous amount of time if I were to train my own text analyzer, so I was down to two options: TextBlob or VADER. After some research on the pros and cons of both, I found out that TextBlob was more suitable for formal writing, while VADER works better on social media content, so I chose VADER.
Part I: Sentiment Analysis
Updating the VADER Dictionary
After a quick look through the VADER documentation, I realized that I could update the VADER sentiment dictionary to fit my needs. Since r/wallstreetbets is the birthplace of many new and original phrases, I would have to not only find an exhaustive list of these terms, but also assign a non-arbitrary sentiment score to them. Though after a couple of minutes of web surfing, my work was cut short for me. Apparently, there had been others who were also interested in analyzing this subreddit's sentiment, and had already created the dictionary with a long list of terms (1, 2, 3). I took inspiration from the three sources and created my own dictionary which is shown below.
wsb_lingo = {'citron': -4.0, 'hidenburg': -4.0, 'moon': 4.0, 'highs': 2.0,
             'mooning': 4.0, 'long': 2.0, 'short': -2.0, 'call': 4.0, 'calls': 4.0,
             'put': -4.0, 'puts': -4.0, 'break': 2.0, 'tendie': 2.0, 'tendies': 2.0,
             'town': 2.0, 'overvalued': -3.0, 'undervalued': 3.0, 'buy': 4.0, "hold": 1.0,
             'sell': -4.0, 'gone': -1.0, 'gtfo': -1.7, 'paper': -1.7, 'bullish': 3.7,
             'bearish': -3.7, 'bagholder': -1.7, 'stonk': 1.9, 'green': 1.9, 'money': 1.2,
             'print': 2.2, 'bull': 2.9, 'bear': -2.9, 'pumping': -1.0, 'sus': -3.0,
             'offering': -2.3, 'rip': -4.0, 'downgrade': -3.0, 'upgrade': 3.0,
             'maintain': 1.0, 'pump': 1.9, 'hot': 1.5, 'drop': -2.5, 'rebound': 1.5,
             'crack': 2.5, "BTFD": 4.0, "FD": 4.0, "diamond hands": 0.0, "paper hands": 0.0,
             "DD": 4.0, "GUH": -4.0, "pump": 4.0, "dump": -4.0, "gem stone": 4.0, "rocket": 4.0,
             "andromeda": 0.0, "to the moon": 4.0}
It is worth noting that sentiment scores are given on a scale from -4 (most negative) to 4 (most positive). Also, another interesting thing about VADER is that in-text emojis are automatically converted into text before analysis. To this end, it was only necessary for me to give a description of the emojis for VADER to be able to pick up on its sentiment. This can be seen above with "rocket" and "gem stone".
Running the Sentiment Analyzer
The code to initialize the VADER Sentiment Analyzer and Dictionary Updating is relatively straightforward and can be found in the VADER documentation. Since 4 outputs will be given for each post, namely the "Negative Signal", "Neutral Signal", "Positive Signal" and "Compound Signal", all of which are normalized scores between -1 and 1, I simply had to append all 4 outputs onto the initial DataFrame. The code is given below.
# Import the necessary libraries
import pandas as pd
from nltk.sentiment.vader import SentimentIntensityAnalyzer

# Update the VADER Sentiment Analyzer with the above terms
sia = SentimentIntensityAnalyzer()
sia.lexicon.update(wsb_lingo)

# Import the cleaned dataframe from the previous step
cleaned_dataframe = pd.read_csv("reddit_with_ticker.csv", lineterminator = "\n")

# Run the post content through VADER and store the output
sentiment_list = []
for content in cleaned_dataframe["all_content"]:
    sentiment_list.append([sia.polarity_scores(content)["neg"], sia.polarity_scores(content)["neu"],
                      sia.polarity_scores(content)["pos"], sia.polarity_scores(content)["compound"]])
sentiment = pd.DataFrame(sentiment_list, columns = ["Sell Signal", "Hold Signal", "Buy Signal", "Compound Signal"])


# Combine the results with the original dataframe
df_concat = pd.concat([cleaned_dataframe, sentiment], axis=1)

# Save the new dataframe as a csv file
df_concat.to_csv('reddit_with_ticker_with_sentiment.csv')
Part II: Metric Incorporation
Taking a look at the Post Metrics
My next step was to incorporate the various metrics I had on post popularity into the overall sentiment score. I took a look at the metrics shown below and found a certain distinction to categorize them - homogeneous and heterogeneous.
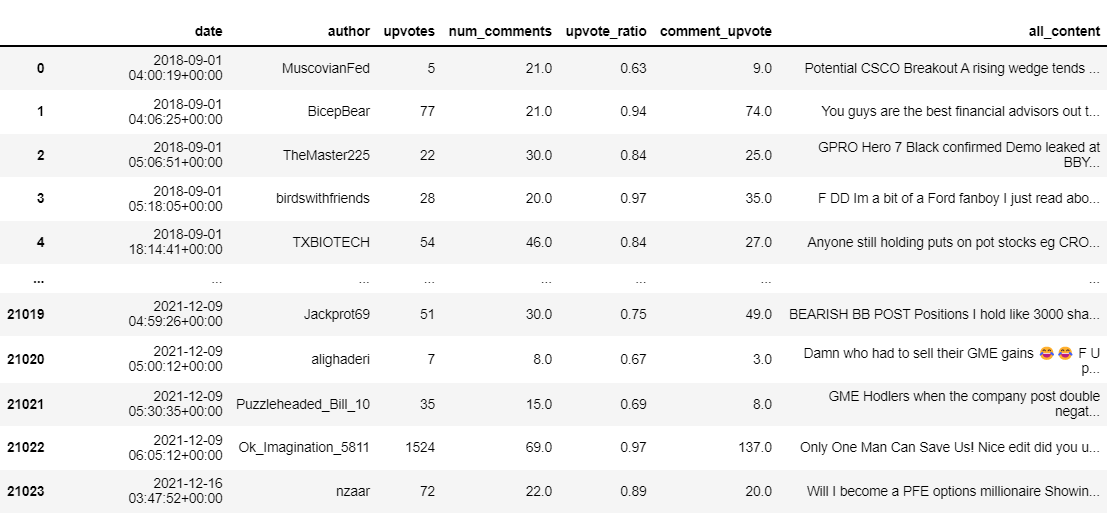
An example of a homogeneous metric would be the upvote ratio, which is evenly spread out between 0 and 1. While heterogeneous metrics include number of comments and number of upvotes, with the majority of posts having only single-digit counts, but a few having extremely high counts.
Homogeneous Data
For homogeneous data, I split them based on percentiles, namely the 20th, 40th, 60th, and 80th, forming five categories altogether. Data that fell into the highest category had their scores multiplied by 1.5. Each following category had decreasing increments of 0.25 in their multipliers, with the scores in the lowest category only being multiplied by 0.5. This means that posts which most agreed with (high upvote ratio) would have their sentiment scores magnified; while highly unpopular posts would have theirs diminished. The functions that are used to achieve this are defined below.
# Obtains the percentiles for homogeneous data
def find_percentiles(data):
    p_20 = np.nanpercentile(data, 20)
    p_40 = np.nanpercentile(data, 40)
    p_60 = np.nanpercentile(data, 60)
    p_80 = np.nanpercentile(data, 80)
    return [p_20, p_40, p_60, p_80]

def updatep(column, data):

    # Store the percentiles in a list
    percentile = find_percentiles(df[column])

    # Split the data into 5 different categories based on percentile
    data[column + "_category"] = np.where(data[column] <= percentile[0], "E", data[column + "_category"])
    data[column + "_category"] = np.where((data[column] > percentile[0]) & (data[column] <= percentile[1]), "D", data[column + "_category"])
    data[column + "_category"] = np.where((data[column] > percentile[1]) & (data[column] <= percentile[2]), "C", data[column + "_category"])
    data[column + "_category"] = np.where((data[column] > percentile[2]) & (data[column] <= percentile[3]), "B", data[column + "_category"])
    data[column + "_category"] = np.where(data[column] > percentile[3], "A", data[column + "_category"])

    # Update the Sentiment score based on the category
    data["Updated Score"] = np.where(data[column + "_category"] == "E", data["Updated Score"]*0.5, data["Updated Score"])
    data["Updated Score"] = np.where(data[column + "_category"] == "D", data["Updated Score"]*0.75, data["Updated Score"])
    data["Updated Score"] = np.where(data[column + "_category"] == "C", data["Updated Score"]*1, data["Updated Score"])
    data["Updated Score"] = np.where(data[column + "_category"] == "B", data["Updated Score"]*1.25, data["Updated Score"])
    data["Updated Score"] = np.where(data[column + "_category"] == "A", data["Updated Score"]*1.5, data["Updated Score"])

    return data
Heterogeneous Data
I thought of using percentiles too for heterogeneous data. However, this led to an error. Given the disproportionately large number of 0s among heterogeneous data, all 4 percentiles used to categorize came out to be 0. This meant that the categorization would fail. Hence, another categorization method had to be used. From my knowledge of statistics, I came up with the method of using mean and standard deviation, though I did not know an explicit formula for categorization. I experimented with varying multiples of standard deviation and found out that increments of 0.5 seemed to fit the data the best. The functions that are used to achieve this are defined below.
def updates(column, data):

    # Find the mean and standard deviations of the data
    mean = np.mean(df[column])
    sd = np.std(df[column])

    # Split the data into 5 categories according to mean plus varying mutiples of sd
    data[column + "_category"] = np.where((data[column] <= mean), "E", data[column + "_category"])
    data[column + "_category"] = np.where((data[column] > mean) & (data[column] <= mean+0.5*sd), "D", data[column + "_category"])
    data[column + "_category"] = np.where((data[column] > mean+0.5*sd) & (data[column] <= mean+sd), "C", data[column + "_category"])
    data[column + "_category"] = np.where((data[column] > mean+sd) & (data[column] <= mean+1.5*sd), "B", data[column + "_category"])
    data[column + "_category"] = np.where((data[column] > mean+1.5*sd), "A", data[column + "_category"])

    # Update the sentiment scores based on the category
    data["Updated Score"] = np.where(data[column + "_category"] == "E", data["Updated Score"]*0.8, data["Updated Score"])
    data["Updated Score"] = np.where(data[column + "_category"] == "D", data["Updated Score"]*0.9, data["Updated Score"])
    data["Updated Score"] = np.where(data[column + "_category"] == "C", data["Updated Score"]*1.1, data["Updated Score"])
    data["Updated Score"] = np.where(data[column + "_category"] == "B", data["Updated Score"]*1.4, data["Updated Score"])
    data["Updated Score"] = np.where(data[column + "_category"] == "A", data["Updated Score"]*1.8, data["Updated Score"])

    return data
Running the above functions
For clarity, I created 6 new variables, 5 to store the result of the categorization, and the remaining 1 to store the updated sentiment score. We run the above functions to obtain the updated sentiment score and append all new columns to the previous DataFrame. The final DataFrame can then be used in correlation analysis.
# Import the necessary modules
import os
import re
import pandas as pd
import numpy as np

# Import the dataframe from the previous step
df = pd.read_csv("reddit_with_ticker_with_sentiment.csv")

# Create new columns for categorization
df["upvotes_category"] = np.nan
df["num_crossposts_category"] = np.nan
df["num_comments_category"] = np.nan
df["comment_upvote_category"] = np.nan
df["upvote_ratio_category"] = np.nan
df["Updated Score"] = df.loc[:, 'Compound Signal']

# Run the above functions on the actual metrics
updatep("upvote_ratio", df)
updates("upvotes", df)
updates("num_crossposts", df)
updates("num_comments", df)
updates("comment_upvote", df)


# Save the updated dataframe as a csv file
df.to_csv("Updated_Data.csv")
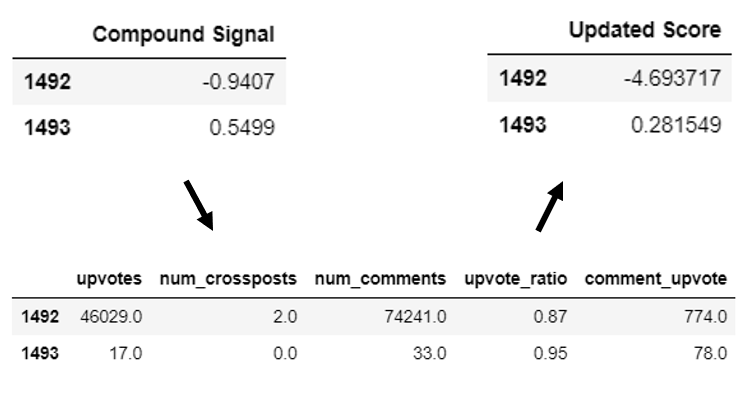
An illustration of the sentiment updating is given below.
Final Thoughts
All in all, I believe I was successful in completing the tasks I set out to do. This was the first time I experienced what it means to be a "Data Scientist" - someone that needs to familiarize themselves with the dataset, and then come up with methods to achieve their goals. I had always thought of Data Science as making use of fancy, complicated models, yet I now know that this cannot be further away from the truth. In reality, it is a mix of experimenting with your data and making deductions about it, quite a messy process to be honest. I hope that my elaborate attempt at explaining my thought process brings some substance to this blog plot.