By Group "Semantic Analysts," written by Prateek Kher
Introduction
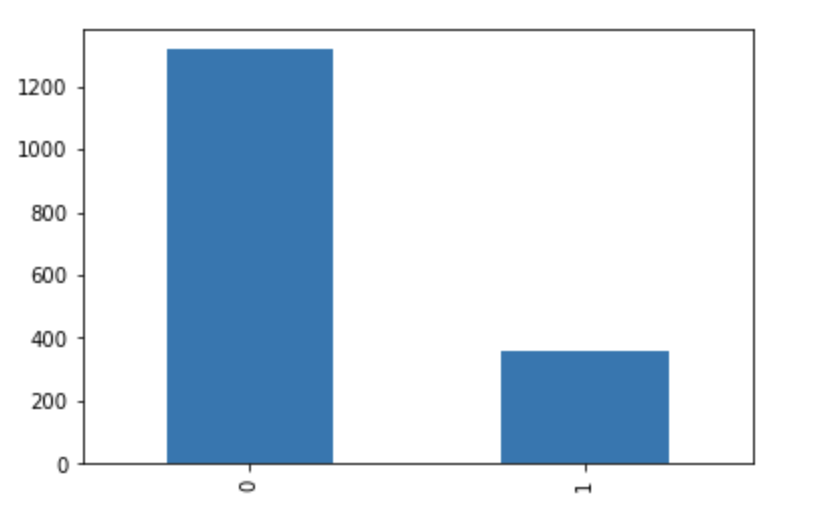
In our initial stages, we were confused as to where to start when it came to data cleaning and further analysis on the cleaned data. This is when we made a formal plan of action, as to what action requires approximately how much amount of time, and created a timeline. After we were done creating a timeline, we delegated the work amongst each other. We knew that before we actually put in the MD&A section data inside our models and conduct feature engineering, we had to make sure the pre-processing was conducted properly and accurately. Before we begin data cleaning, the following graph shows the distribution of our training data, i.e., the distribution between fraudulent and non-fraudulent companies.
Cleaning and Pre-Processing
As our previous blog showed, we have a dataframe which consists of CIK of the report, coupled with the year it was published, whether it is fraudulent or not, and the MD&A section. The data cleaning broadly incorporates the following steps: 1) Expanding Contractions 2) Lowercase Updating 3) Removing Punctuations and RegEx 4) Removing Digits 5) Removing Stopwords 6) Removing Symbols and Markdown
The pre-processed data contains a considerable amount of contractions, which are eliminated using a custom-made dictionary that stores contractions in the form of “Contraction”: “Full Form” as the “Key”: “Value” pair. Figure 2.2 below shows the dictionary representation of the contractions as explained. The contractions need to be expanded as it becomes easier for the compiler to understand the cleaned data without apostrophes and give more accurate results.
We created a dictionary of contractions, which will be used to expand on the specific contractions as mentioned, a sample of which is shown below:
#creating a dictionary of contractions

contractions = {
"ain't": "is not",
"aren't": "are not",
"can't": "cannot",
"can't've": "cannot have",
"'cause": "because",
"could've": "could have",
"couldn't": "could not",
"couldn't've": "could not have",
"didn't": "did not",
"doesn't": "does not",
"don't": "do not",
"hadn't": "had not",
"hadn't've": "had not have",
"hasn't": "has not",
"haven't": "have not",
"he'd": "he would",
"he'd've": "he would have",
"he'll": "he will",
"he'll've": "he he will have",
"he's": "he is",
"how'd": "how did",
"how'd'y": "how do you",
"how'll": "how will",
"how's": "how is"
}
The python code below shows the procedure by which we conducted the above procedures by creating cleaning functions, and parsing the MD&A section data through these functions.
#function for defining contraction's:

def expand_contractions(text):
    for word in text.split():
        if word.lower() in contractions:
            text = text.replace(word, contractions[word.lower()])
    return text

#function for removing unicode data :

def remove_accented_chars(text):
    text = unicodedata.normalize('NFKD', text).encode('ascii', 'ignore').decode('utf-8', 'ignore')
    return text

REPLACE_BY_SPACE_RE = re.compile('[/(){}\[\]\|@%$,;-_]')
BAD_SYMBOLS_RE = re.compile('[^0-9a-z #+_]')
STOPWORDS = set(stopwords.words('english'))

#function for removing all the scrub words
def scrub_words(text):
    #Replace \xao characters in text
    text = re.sub('\xa0', ' ', text)

    #Replace non ascii / not words and digits
    text = re.sub("(\\W|\\d)",' ',text)

    #Replace new line characters and following text until space
    text = re.sub('\n(\w*?)[\s]', ' ', text)

    #Remove html markup
    text = re.sub("<.*?>", ' ', text)


    return text

def clean_text(text):
    """
        text: a string

        return: modified initial string
    """
    text = REPLACE_BY_SPACE_RE.sub(' ', text) # replace REPLACE_BY_SPACE_RE symbols by space in text
    text = BAD_SYMBOLS_RE.sub(' ', text) # delete symbols which are in BAD_SYMBOLS_RE from text
    text = ' '.join(word for word in text.split() if word not in STOPWORDS) # delete stopwords from text
    return text
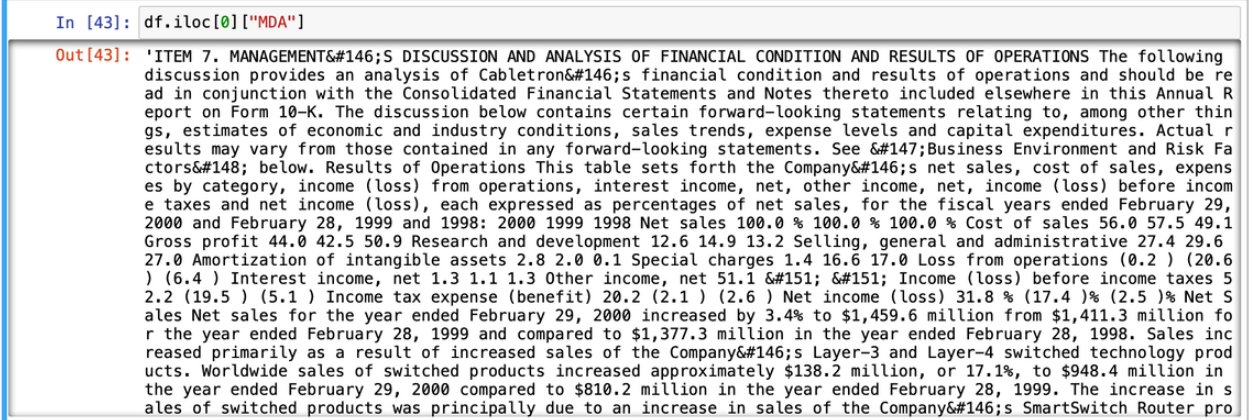
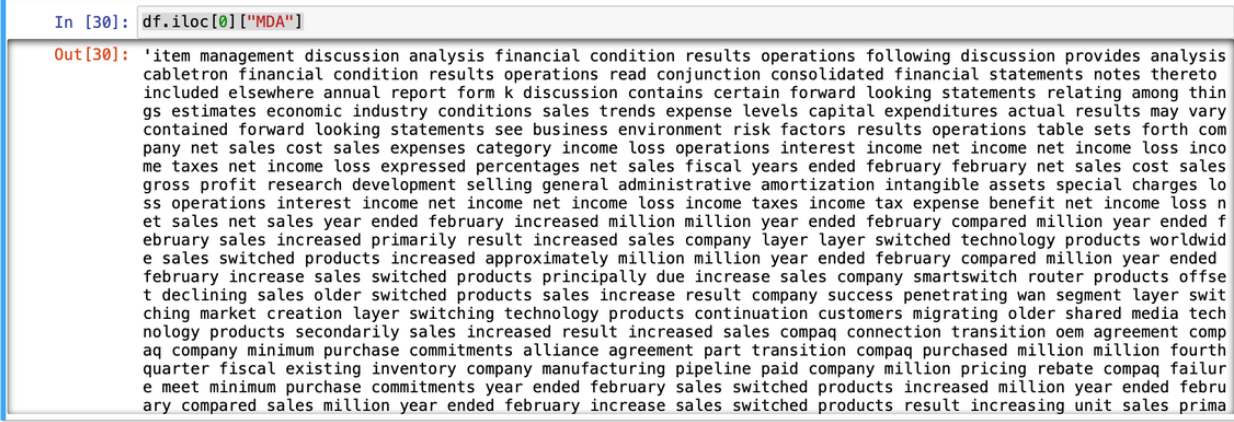
Now that we conducted the cleaning, I thought it would be nice to show what our data looked like before cleaning vs after cleaning, and the result is satisfying to see!
Pre Cleaning:
Post Cleaning:
Loughran-McDonald Master Dictionary
The following thought came about in our group discussion when me and my group-mate were sitting together and having dinner. We thought it would be nice to analyse the tone of our MD&A sections, as in many cases, establishing a lexicon is the first step in determining the tone of an annual report, earnings press release, or IPO prospectus. Positive, negative, and neutral words are classified in the dictionary (e.g., uncertainty, litigious, or weak modal). Positive terms make up a large portion of optimistic documents, while negative terms make up a large portion of pessimistic writings. Diction (www.dictionsoftware.com), a tool that parses articles into words before tabulating the words into functional categories, is a popular platform for analyzing tone in the accounting and finance literature. Despite their widespread use in the literature, Diction's optimistic and pessimistic word lists were not designed specifically for financial publications. Readers of 10-Ks are unlikely to think of managers who describe existing and future operations using words like respect, necessity, security, power, trust, authority, or discretion as hopeful. When terms like "not," "none," "death," "suffering," "vice," and "lynch" appear in corporate messaging, they are not considered negative. With corporate communication in mind, LM prepared positive and negative word lists for use in the financial sector. We extracted the opinion information type using the LM dictionary, with the purpose of extracting important features using SFL. LM is used to compute the number of positive and negative word ratios in our document.
Therefore, while completing this project, we thought something was missing, and we were unable to identify what. We brainstormed for hours, and then came up with the answer to our question. The issue we were having was, that the project was not "human" enough. We therefore decided to conduct some sentiment analysis, and get some human emotions involved (specially using the dictionary above).
We tried to give our code life, using the functiosn given below, which gave them score based on their features and emotion:
def positive_score(text):
    numPosWords = 0
    rawToken = text.split()
    for word in rawToken:
        if word in positiveWordList:
            numPosWords  += 1

    sumPos = numPosWords
    return sumPos

def negative_score(text):
    numPosWords = 0
    rawToken = text.split()
    for word in rawToken:
        if word in negativeWordList:
            numPosWords  += 1

    sumPos = numPosWords
    return sumPos

def uncertain_score(text):
    numPosWords = 0
    rawToken = text.split()
    for word in rawToken:
        if word in uncertainWordList:
            numPosWords  += 1

    sumPos = numPosWords
    return sumPos

def litigious_score(text):
    numPosWords = 0
    rawToken = text.split()
    for word in rawToken:
        if word in litigiousWordList:
            numPosWords  += 1

    sumPos = numPosWords
    return sumPos

def strong_modal_score(text):
    numPosWords = 0
    rawToken = text.split()
    for word in rawToken:
        if word in strongModalList:
            numPosWords  += 1

    sumPos = numPosWords
    return sumPos

def weak_modal_score(text):
    numPosWords = 0
    rawToken = text.split()
    for word in rawToken:
        if word in weakModalList:
            numPosWords  += 1

    sumPos = numPosWords
    return sumPos

def constraining_score(text):
    numPosWords = 0
    rawToken = text.split()
    for word in rawToken:
        if word in constrainingList:
            numPosWords  += 1

    sumPos = numPosWords
    return sumPos

def complexity_score(text):
    numPosWords = 0
    rawToken = text.split()
    for word in rawToken:
        if word in complexityList:
            numPosWords  += 1

    sumPos = numPosWords
    return sumPos
Exploratory Data Analysis and Visualization
It is always useful to visualise the data in the form of graphs and charts, and we tried to do the same as there is no better way than visualisation for a lay-man to understand what we are dealing with. We conducted this work using libraries such as matplotlib, sns, plotly, etc.
EDA
Here are some basic features of our data shown in the picture below:
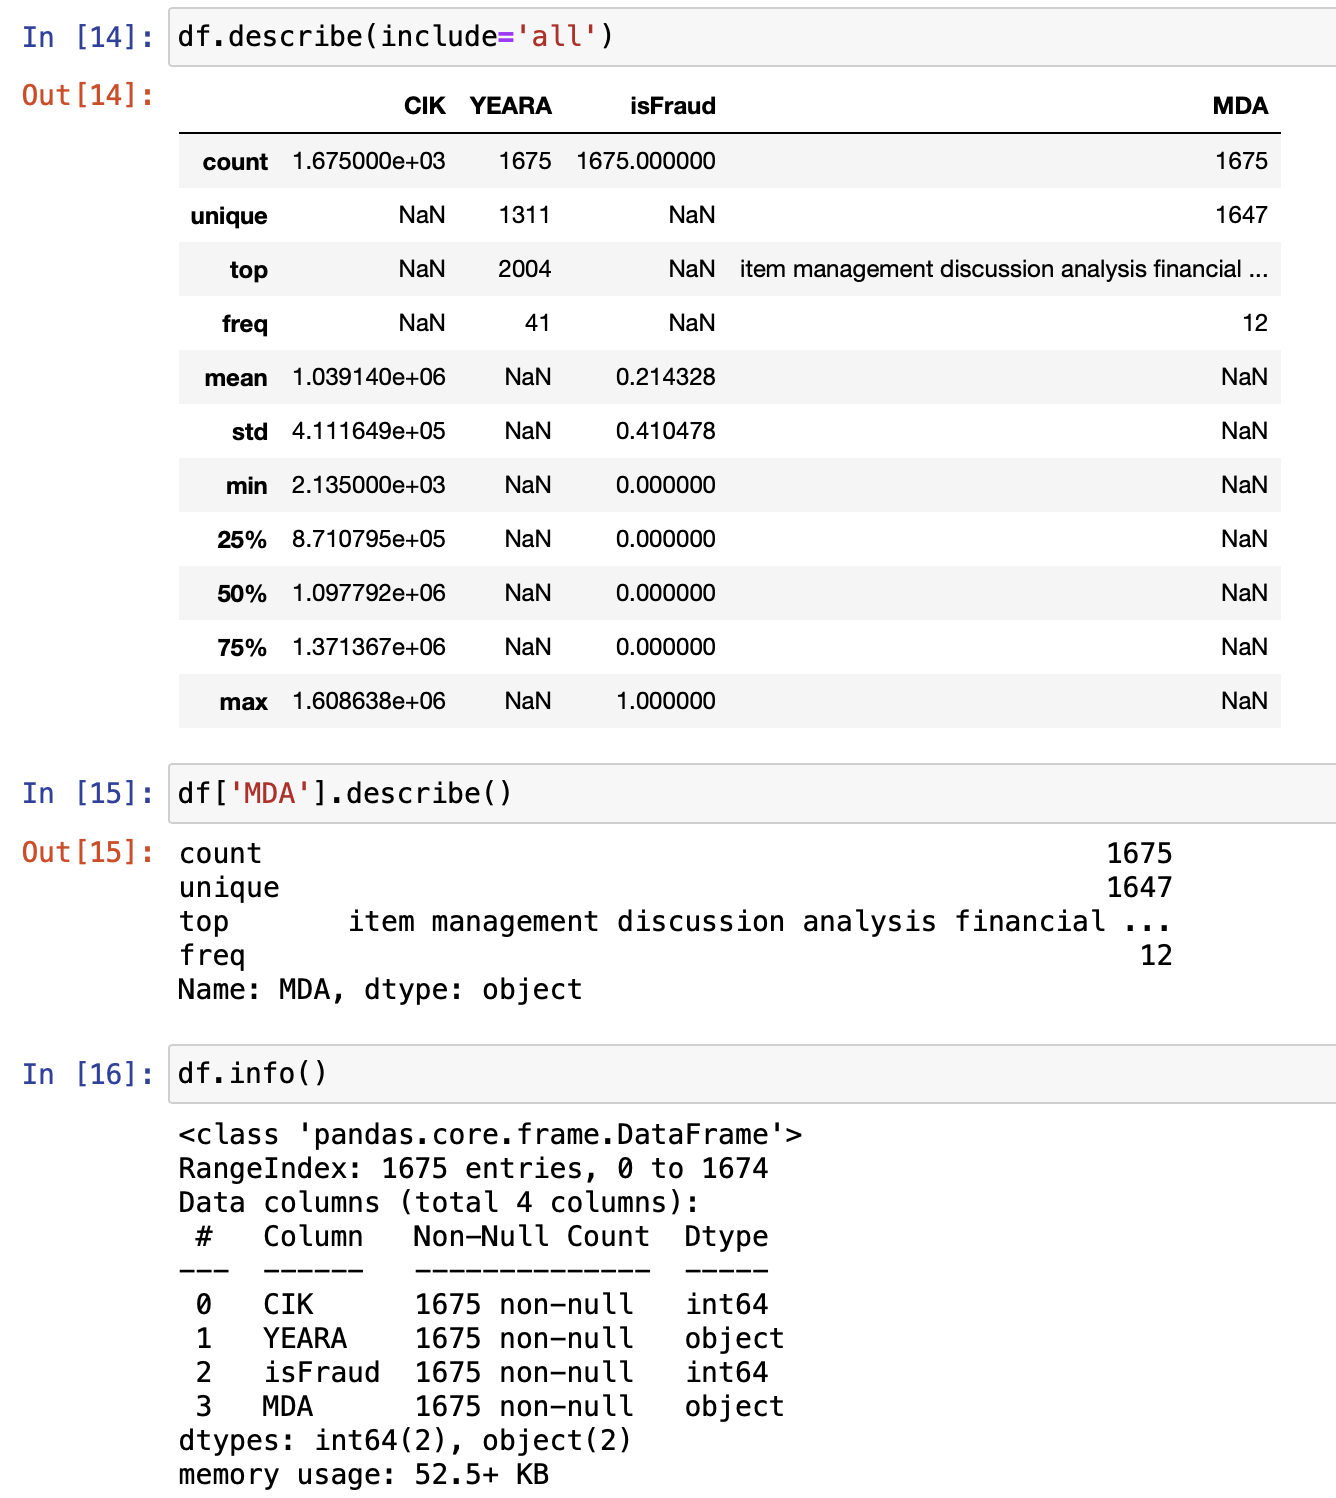
These features are key to understanding our data, and they go on to represent that we have used extensive data for our training set!
Visualisation
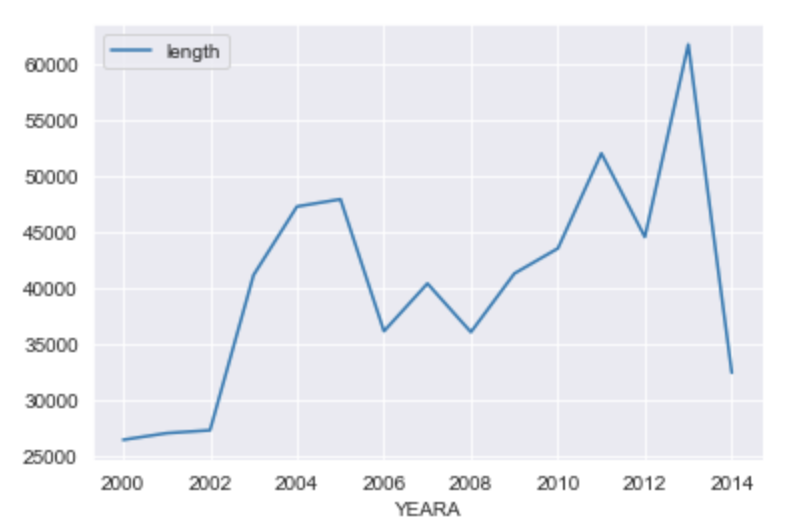
We have seen visualization helps understand the code better. Before starting the project, we wanted to make sure that our data is diverse in various terms, and to signify that (give one example) we have the graph below which shows the average length of MD&A sections of the reports over the span of various years.
The wordcloud below shows the different words used in the fraudulent companies MD&A sections. We got to create this wordcloud primarily due to curiosity! We were curious to see which pictures occur more than others!

Final Remarks for This Blog Post
To conclude and give final remarks, I would say that this part of the project involves considerable amout of labor, but is yet diversifiable. What I mean by that is, EDA and visualisation is heavily customisable, and depends on person-to-person to know to what extent to work with EDA and visualisation. I believe this process can be extremely rewarding, like it was for me, as I learnt a lot through this process, but also can bring about considerable difficulties, and test your tenacity and patience. Still, keep going data scientists, and you will inevitably learn something new along the way!