By Group NetFin
FinBERT vs Alpha Vantage – Rethinking Our Sentiment Signal
At the beginning of our project, we decided to use Alpha Vantage’s NEWS_SENTIMENT API to deliver us the specific NVDA-related scores for our event study. However, due to our project scope is relatively small and considering the leveraging effect of hte AI-related events news annoucement, we doubted about whether AlphaVantage’s score was accurate and suitable for our specific project scope.
To address this issue, we decided to conduct a cross-validation between Alpha Vantage’s scores and FinBERT as our academic benchmark. We selected 35 NVDA‑related news articles from our dataset and constructed a small sample size to investigate the sentiment behaviour in both models.
Lower-Granularity FinBERT Scores vs. Continuous Alpha Vantage Scores
After running the 35 articles (including body text) through our local FinBERT model, we realized that the scores delivered by the model were highly concentrated around three values: -1, 0, and +1. Fundamentally, FinBERT is used like a three-class classifier (negative, neutral, or positive). A slightly negative headline would deliver the same score as a highly negative one, and vice versa for positive content.
On the other hand, Alpha Vantage’s NVDA Sentiment Scores are delivered on a continuous scale but are limited to a specific range. There is a range of “slightly negative,” “strongly negative,” “cautiously positive,” and “very bullish.” Has a gradation on a smaller scale. This is more beneficial for event studies and factor construction for our product scope.
Correlation Check: FinBERT vs. Alpha Vantage
To see how the two systems correlate with each other, we computed the Pearson correlation between FinBERT’s document‑level scores and Alpha Vantage’s NVDA sentiment scores on the 35‑article sample. The scatter plot, as shown below (see Figure 1) reflected a moderate positive correlation of about (r = 0.49). This indicates that when Alpha Vantage reports more positive sentiment for Nvidia, FinBERT tends to report in the same direction, but there is still substantial dispersion around the trend line (points far away from the trendline).
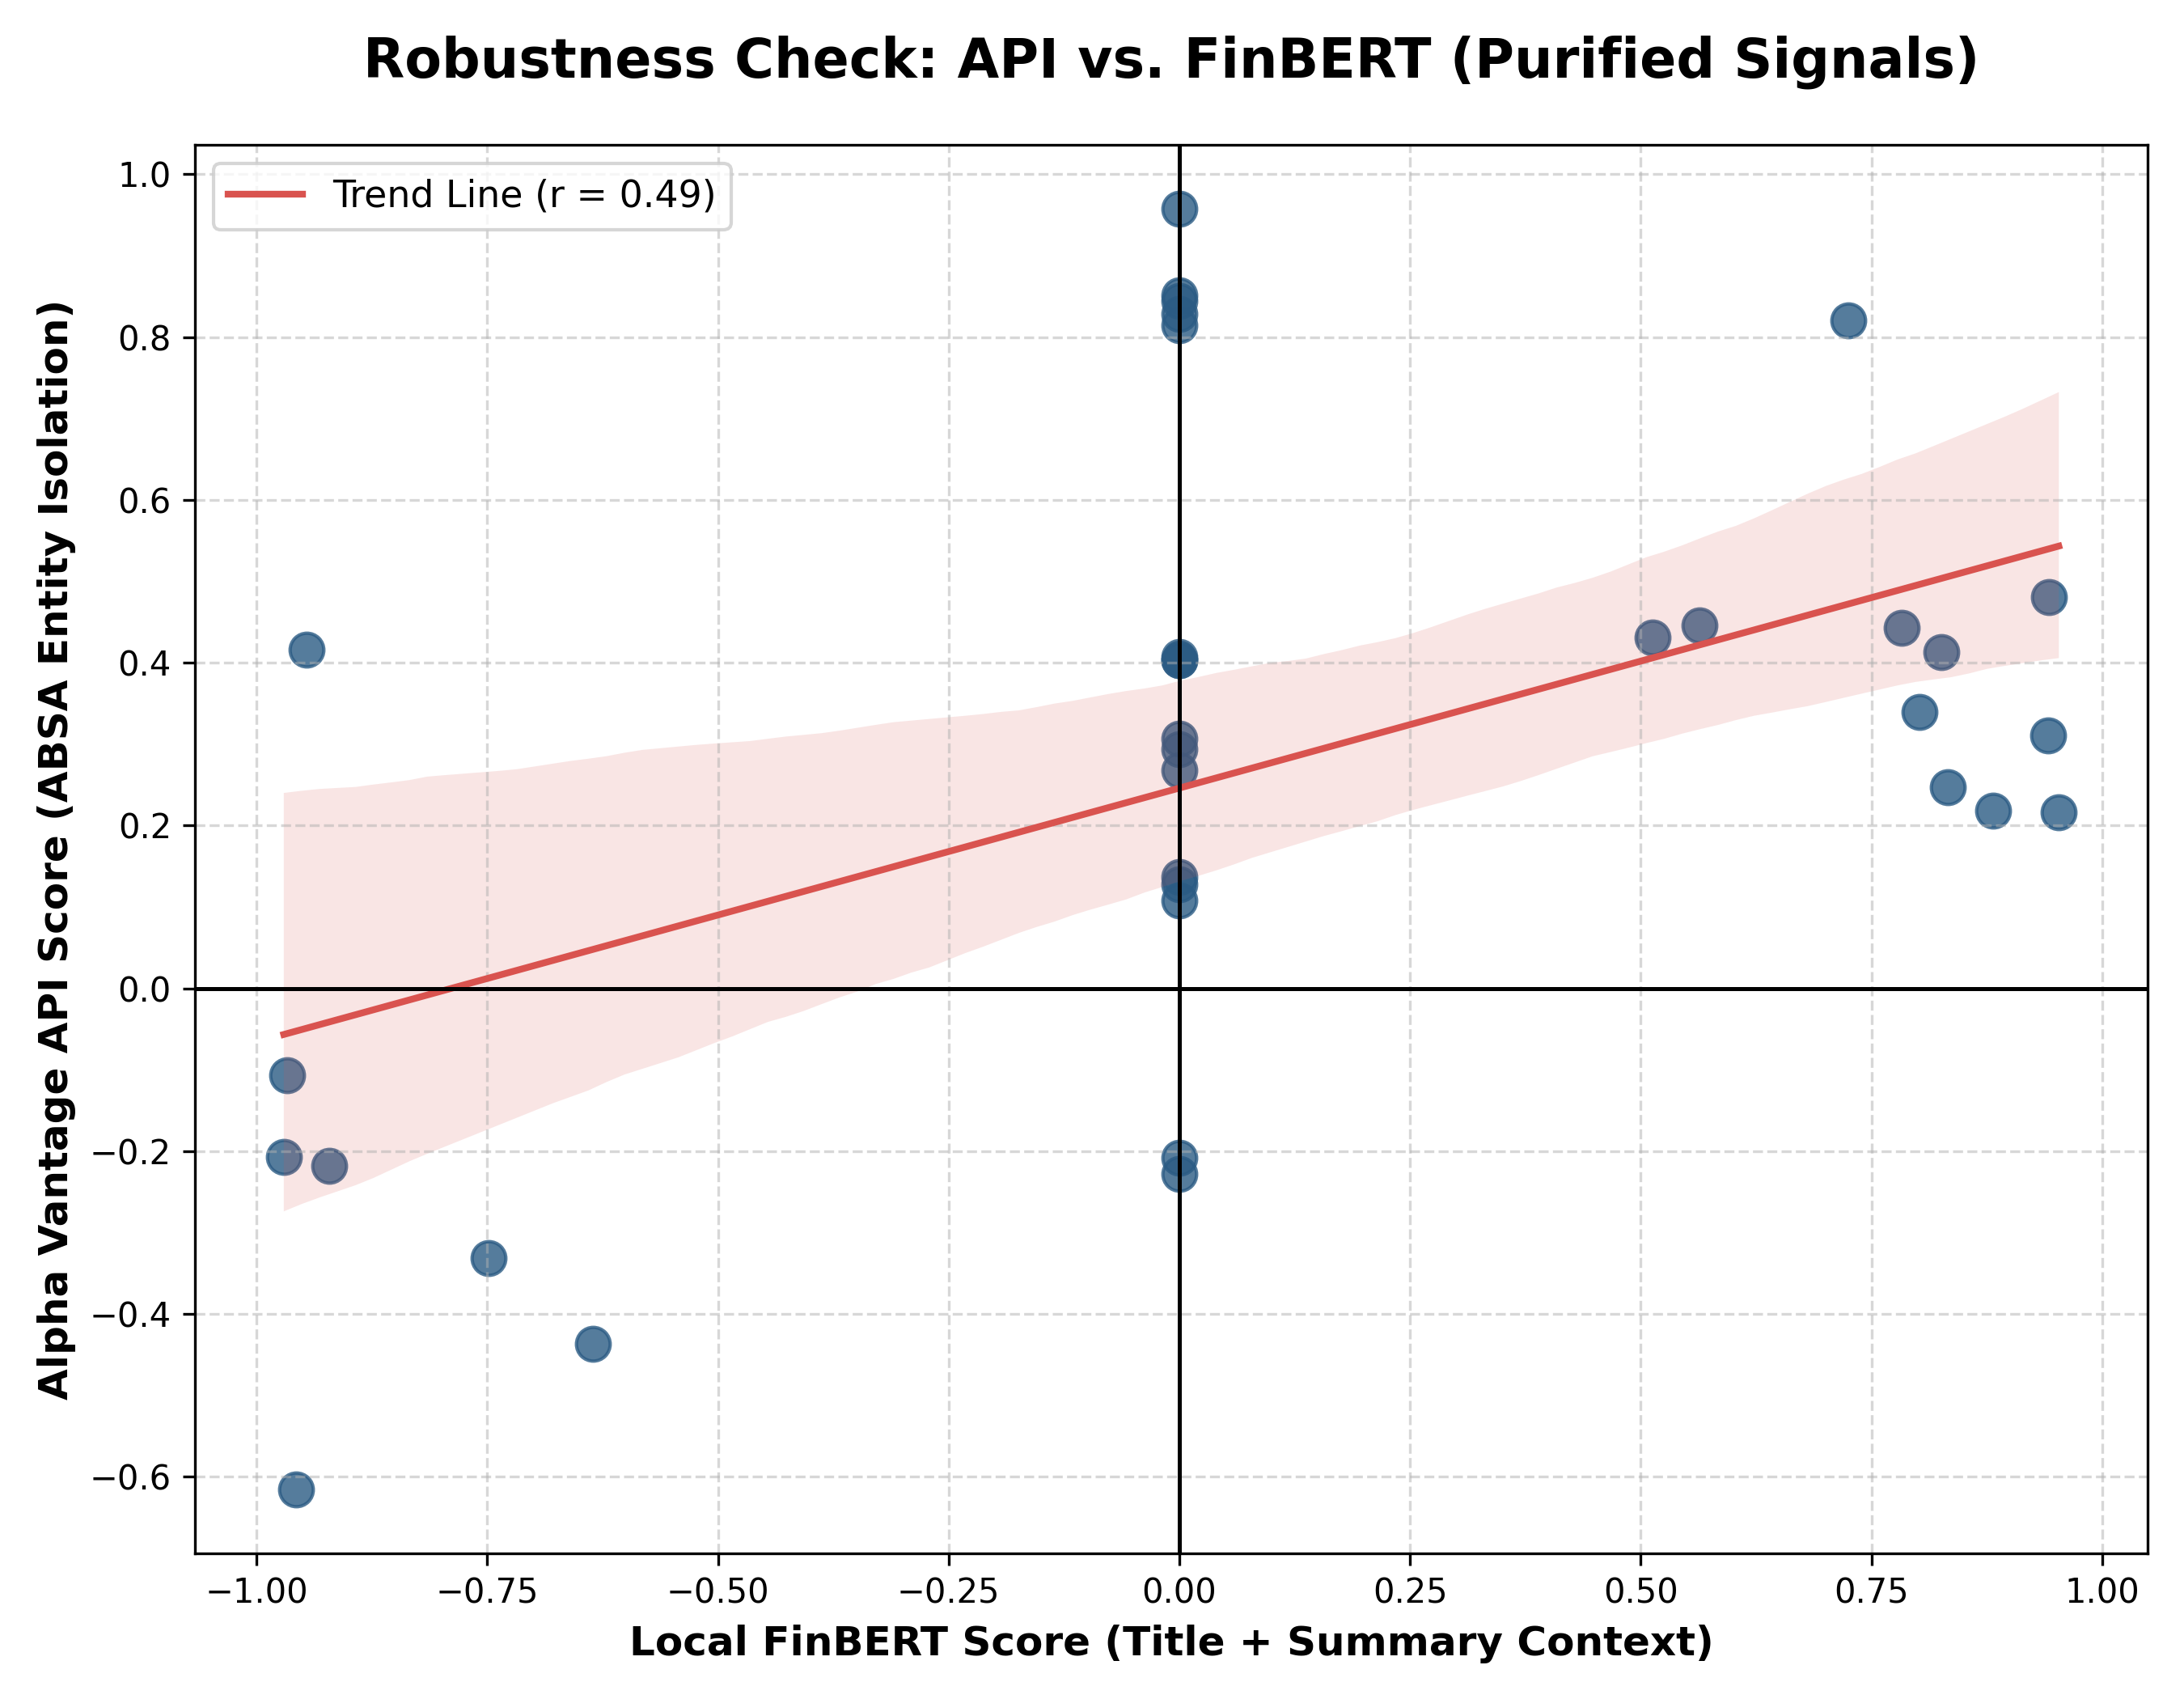
In Figure above, the red shaded area around the fitted line represents the 95% confidence interval, indicating the uncertainty range of the estimated linear relationship.
This pattern aligns with our expectations when comparing a lower-granularity three-class classifier with a continuous score. The correlation proves that Alpha Vantage is not “random” with respect to FinBERT, but both models are measuring a broadly similar concept of good/bad news. Moreover, as (r) is not close to 1, it further discloses that the two models are not interchangeable, and Alpha Vantage provides additional nuance that could not be represented by FinBERT’s -1/0/+1 labels on their own.
Why We Chose Alpha Vantage (For Now)
We decided to keep Alpha Vantage as the primary sentiment input for this phase of the project with reasons as follows:
- FinBERT’s outputs in our current setup are too "chunky" at −1, 0, and +1, which limits granularity and makes it harder to detect minor changes in news tone.
- Alpha Vantage provides a continuous, more nuanced sentiment score that varies smoothly across articles and time, which is better aligned with our event‑study design and regression‑based analysis.
- The moderate positive correlation ( r = 0.49 ) between the two systems confirms that Alpha Vantage is directionally sensible while still offering extra detail beyond FinBERT’s three-class labels.
Methodological Justification
Sentiment Measurement: We use Alpha Vantage sentiment scores rather than FinBERT classifications. FinBERT outputs coarse three-class sentiment labels (−1, 0, +1), which are less granular for quantitative analysis. Alpha Vantage provides continuous sentiment scores, offering finer differentiation and greater statistical power for event study regressions.
Why Our Data Workflow Is Not Linear
This analysis fundamentally changed how we view our data pipeline. We initially imagined a sequential workflow: download Alpha Vantage sentiment, merge it with price data, run the event study, and interpret the results. However, our doubts about accuracy—and the subsequent FinBERT correlation study—forced us to loop back and reconsider what "sentiment" we actually want to capture.
The result is an iterative, non-linear process. While we’re sticking with Alpha Vantage for now due to its continuity, we now view this as a design checkpoint rather than a final destination.
It reminds us that building a reliable sentiment factor in the real world isn't about following a one-way map; it’s about having the flexibility to revisit your assumptions when the data reveals a gap in nuance. We might eventually build a hybrid engine that captures the best of both models, but that evolution is only possible because we took the time to look under the hood today.