By Group NetFin
Defining T=0 - Cleaning AI News Data for an NVDA Event Study
Our group project explores how major AI-related news affects NVIDIA’s stock return by applying an event study with NLP-based sentiment analysis from Alpha Vantage’s NEWS_SENTIMENT API. In this blog post, one of the decisions that proved to be unexpectedly tricky for us was how to properly define T=0 and clean AI news data so that each event has a clear and defensible date associated with it. In theory, defining the event date sounds like a simple task, but when dealing with real-life data and news articles with multiple headlines and non-trading days, it becomes a data cleaning issue rather than a theory-based one.
At a high level, our event study wants to ask a simple but interesting question: How does the stock return of NVDA respond to a major AI-related event or product release when it appears in the news? To do this properly, however, we must convert the messy data of news articles into a clean event study format where T=0 is the day the stock can respond to the event, and T=-1, T=+1, etc., are the days around the event. If our definition of T=0 is incorrect, then our abnormal stock return calculation and our understanding of how AI-related news affects the stock would be directly impacted.
Event Taxonomy: Four Shock Categories
To build a structured and reproducible event set, we classify AI-related news into four categories, each corresponding to a different economic transmission channel to NVDA returns.
- Capability Shocks (Model & Algorithmic Milestones)
- Hardware Architecture Shocks (AI Dedicated Hardware & Chips)
- Policy / Regulatory Shocks (AI Policy & Geopolitical Controls)
- Corporate Landscape Shocks (Commercial & Capital Milestones)
Problem 1: Multiple news items per event
We start from a curated list of 20 AI-related events per news category (shown as above). For each of these events, we used Alpha Vantage to pull a labelled news feed, which returns multiple headlines, each with fields like:
publish_datetitlesourcenvda_relevancenvda_sentiment_scoreoverall_sentiment_scoreurlsummary
Here, nvda_relevance is a ticker-specific relevance score indicating how strongly the article is related to NVDA, and nvda_sentiment_score is the sentiment polarity for the NVDA ticker extracted from the article. The overall_sentiment_score summarizes the overall tone of the article across all tickers.
When we examined the downloaded CSV, we found that the news we fetched may have different publish_date values under what we considered the same conceptual AI event. As an example, the DeepSeek event appears many times in our Alpha Vantage news feed. Several headlines across different dates all describe essentially the same AI evnet:
| publish_date | title |
|---|---|
| 2025-01-27 16:18:00 | Nvidia loses nearly 600 billion in market value after Chinese AI startup bursts onto scene |
| 2025-02-12 04:32:21 | DeepSeek Shows There Is No Longer One AI Trade, but Many (version 1) |
| 2025-02-12 04:32:21 | DeepSeek Shows There Is No Longer One AI Trade, but Many (duplicate row) |
| 2025-02-15 04:05:12 | Is Broadridge, Verint testing new Chinese chatbot DeepSeek for automation, efficiency |
| 2025-02-27 10:56:00 | Tencent fires up AI race with model it says outdoes DeepSeek |
This creates a problem for event definition. If we treat every headline as a separate event, we artificially inflate our sample size and double-count what is essentially the same AI announcement. On the other hand, if we simply choose the first headline by time, we might introduce bias in the sentiment we associate with that event, especially if later articles focus more explicitly on NVDA’s role.
To resolve this, we decided to use the news item with the highest nvda_relevance score for NVDA, using the ticker-specific relevance fields that Alpha Vantage provides. In other words, for each conceptual AI event, we select the article where NVDA is most central to the content, rather than one that merely mentions the news in passing. This “max relevance per event” rule gave us a transparent, reproducible way to map multiple raw news items into a single event-level observation.
Problem 2: Non-trading publish dates
After we selected one article per conceptual event, the next concern was how we should map the publish_date of the article to T=0. Our first approach was to use a naive rule and let T=0 be the calendar date on which the article was published. Unfortunately, this approach does not work well when the article is published over a weekend or on a market holiday. NVDA does not trade on Sundays, which means we do not have any return data available for that date, but the news is already out, and the stock might start reacting as soon as the market opens.
While the event study literature generally defines the event date as the time the information is made available to the market, in empirical implementation we must work with trading days, not raw calendar days. As a consequence, we followed a standard approach and defined trade_date, which is the next available US trading day, as T=0 for our returns. For example:
- If the article is published on a Sunday, then T=0 will be Monday.
- If the article is published on a market-holiday Monday, then T=0 will be Tuesday.
In this way, we guarantee that T=0 is always a trading day when the stock of NVDA might actually start reacting to the news.
The code we use is as follows:
# Convert publish_date -> trade_date:
    #   if publish_date is a weekday, keep that date;
    #   if it's weekend, roll forward to next weekday.
    def to_trade_date(ts: pd.Timestamp) -> pd.Timestamp:
        # Drop time; we only care about the date
        d = ts.normalize()
        # Weekday: Monday=0, Sunday=6
        if d.weekday() < 5:
            # Already a weekday: treat as trade_date
            return d
        # Weekend: add 1 business day (next Mon–Fri)
        return d + bday

    df["trade_date"] = df["publish_date"].apply(to_trade_date)

    return df
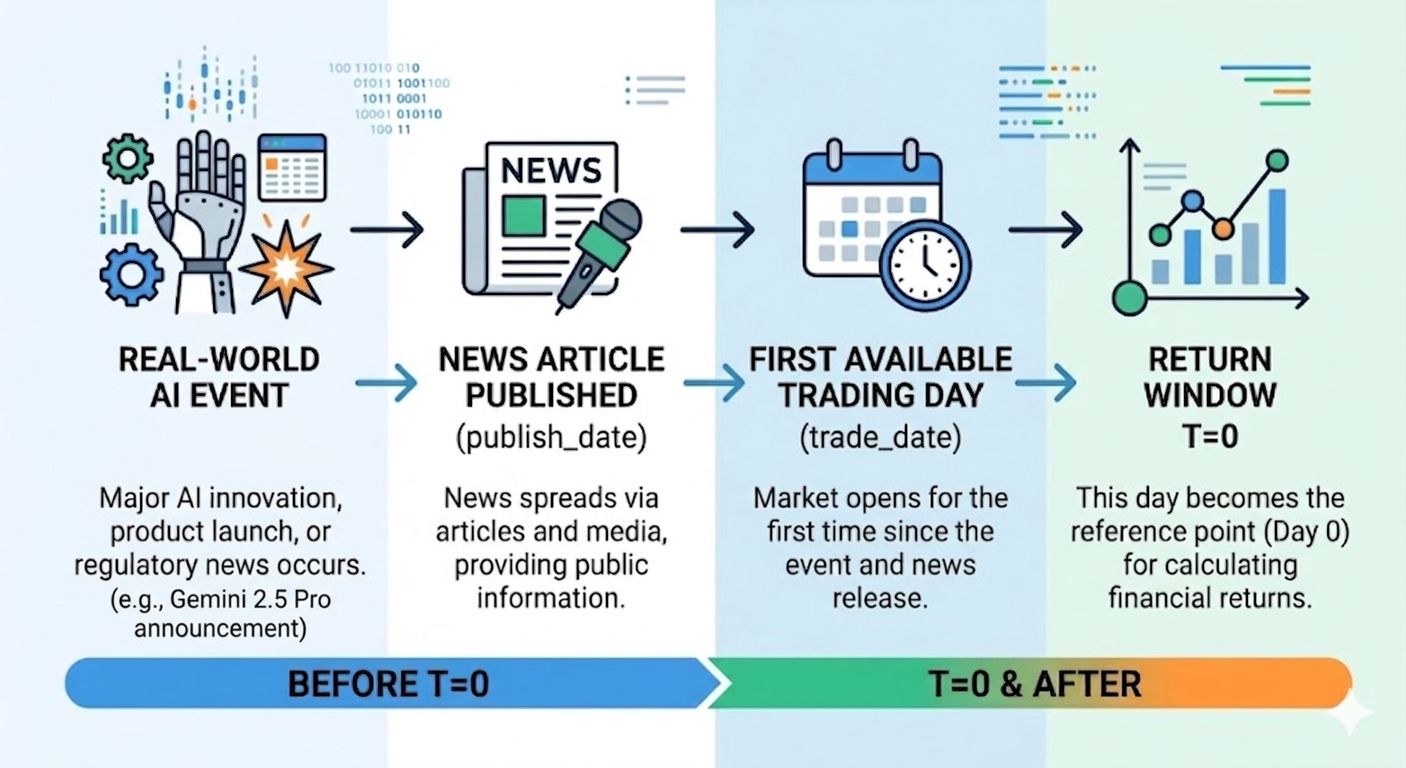
In our dataset, we therefore use three related dates:
event_date: the conceptual AI event or milestone date from our curated list.publish_date: the timestamp when the representative article was published in the news feed.trade_date: the next available trading day in the US market, which we use as T=0 in the event study.
The timeline can be summarized as: