By Group "The Gold Diggers"
Introduction
Our project explores whether text-based information can help explain gold market volatility beyond what traditional market data alone can capture. We focus on gold volatility because gold is often treated not only as a financial asset, but also as a market that reacts strongly to monetary signals, macro uncertainty, and geopolitical tension. While our proposal focused on the broader motivation behind this topic, this blog post focuses on the process of building the data pipeline that made our analysis possible.
As the project developed, we realized that collecting relevant sources was only the first step. The harder challenge was turning those materials into a dataset that could support volatility modeling and later narrative interpretation. In that sense, the data pipeline itself became an important part of the project.
Our Initial Data Collection
At the beginning of the project, our team divided the topic into three broad areas: monetary, fiscal, and geopolitical. This gave us a practical way to organize the project and identify the types of narratives that might influence gold volatility.
Using this framework, we collected materials and organized them into shared folders. This early dataset was useful because it helped us understand the topic, identify recurring themes, and build a broad picture of the information environment surrounding the gold market. In that sense, the first stage of collection worked well as an exploratory resource.
However, this initial collection was designed mainly for topic understanding rather than for direct time-series modeling. That distinction became important once we moved into the next stage.
The Limitation We Encountered
As our project shifted from exploration to analysis, we needed a baseline model for capturing gold volatility more formally. This led us to GARCH, which is widely used in financial time-series analysis because it allows volatility to vary over time instead of assuming that it remains constant.
At this point, we encountered a key limitation. A model such as GARCH does not just require relevant information. It requires observations that are sufficiently dense, consistently aligned across trading days, and structured in a way that supports estimation over time. The materials we had initially collected were useful for understanding the topic, but they were not yet organized in a format that could directly support this kind of modeling.
This was the point where our workflow had to change. Instead of relying on the initial collection alone, we needed to build a new dataset specifically designed for modeling.
Building a New Modeling-Ready Dataset
To construct a dataset suitable for volatility analysis, the first challenge was identifying a denser and more systematic set of news sources. This step was carried out with BigQuery. In practice, finding the “right” sources was not only about quantity. The sources also had to be free and accessible enough for us to actually build the dataset ourselves. Many potential sources were ruled out because they were gated behind paywalls or were otherwise difficult to extract from in a scalable way.
The first few BigQuery attempts did not work well: some searches returned too much data to be manageable, while others returned too little to provide sufficient coverage. As a result, source discovery became an iterative process of refinement. It is also important to note that BigQuery did not provide the article text itself. Instead, it helped identify the URLs of potentially relevant sources, after which a separate extraction script was needed to pull the actual text from those URLs.
After repeated adjustments, the search strategy produced a more reasonable source pool. The resulting curated list contained more than 6,400 macroeconomic and financial-news URLs. From there, the task shifted from identifying possible sources to extracting clean article text from them.
In practice, the source-selection stage was guided by three practical criteria:
- the source had to provide a sufficient number of relevant news items,
- the source had to be free or at least accessible enough for us to work with at scale,
- the source had to be usable in a pipeline where URLs could be identified first and article text could then be extracted separately.
This extraction stage became one of the most meaningful technical parts of the project. News webpages often contain paywalls, boilerplate text, or incomplete article bodies, so collecting URLs alone was not enough. To solve this, the workflow used browser impersonation and article parsing tools to retrieve the core text from raw webpages. After filtering out very short or unusable outputs, the pipeline retained 3,252 full-text articles across a 36-month period.
A simplified version of this extraction logic is shown below. Although the actual implementation was more detailed, this example captures the core idea of retrieving a webpage, parsing the article, and keeping only texts that were substantial enough to be useful for later analysis.
from curl_cffi import requests
from newspaper import Article

url = "https://example.com/article"

response = requests.get(url, impersonate="chrome")
article = Article(url)
article.set_html(response.text)
article.parse()

text = article.text.strip()

if len(text) > 200:
    print("Usable article extracted")
This step reflects an important idea in the project: raw online information is not automatically ready for analysis. A meaningful part of the work lies in converting messy webpages into usable text.
From Master Data to a RAG-Ready Output
Once the article texts had been extracted and filtered, the next challenge was to align them with market data in a consistent daily format. The text-side information was organized into three thematic variables — Monetary, Fiscal, and Geopolitics — while a News_Context field preserved the broader narrative information for each trading day. This was then merged with Yahoo Finance data for GC=F gold futures, including close prices and log returns.
This produced a daily master dataset that could support volatility modeling. On top of this dataset, Baseline GARCH(1,1) and NLP-Augmented GARCH-X(1,1) models were fitted, generating two comparable volatility series. These outputs were then merged into the final file, fina2350_master_dataset_for_rag.csv, which contains market variables, thematic text features, contextual text, and both model-based volatility measures in one place.
This final dataset is important because it acts as a bridge between two stages of the project: statistical volatility modeling and downstream RAG-based interpretation.
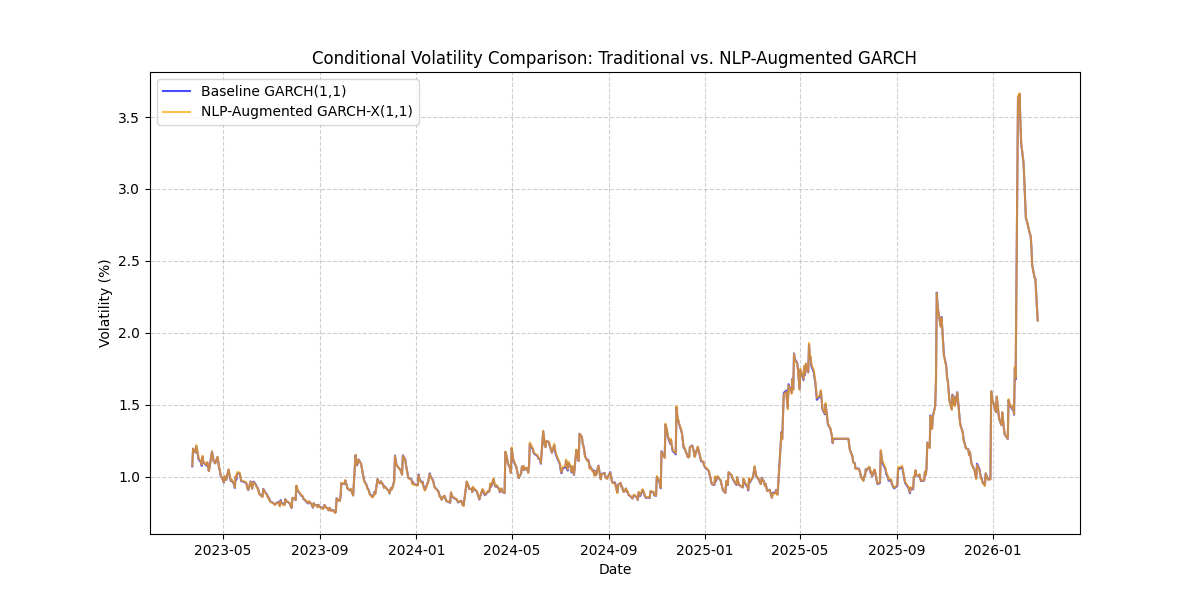
Figure 1. Comparison of conditional volatility from the baseline GARCH and NLP-augmented GARCH-X models.
What We Learned
This process taught us that exploratory data collection and modeling-ready data construction are not the same task. At the beginning of the project, it was easy to assume that gathering relevant sources would be the hardest part. In practice, the more difficult challenge was creating a dataset with the right level of continuity, alignment, and structure for time-series analysis.
More broadly, the project showed us that data engineering is not just a supporting step before analysis begins. In our case, source identification, text extraction, filtering, daily aggregation, market-data alignment, and volatility modeling were all necessary parts of the analytical design itself. The result of this process is more than a cleaned spreadsheet: it is a dataset that connects quantitative volatility estimates with narrative context, making the next stage of RAG-based interpretation possible. In the near future, we plan to use this final dataset for RAG-based interpretation of major volatility episodes. By doing so, we hope to move beyond measuring volatility and begin explaining it through the narrative context captured in the underlying news data.